


Reintroducing The Concept Of Stock Market Investing Risk
Companies / Risk Analysis Feb 24, 2018 - 01:22 PM GMTBy: WMA

 It has been a while. Aside from a bit of turbulence at the end of 2015 and the beginning of 2016, those investors turning a blind eye to financial market risk enjoyed a winning strategy since 2011. Equity market volatility had been particularly subdued from the U.S. election in November 2016 until this month. We knew that this extreme complacency had to end…it just lasted longer than any rational analyst could have predicted.
It almost seems perverse to write a Commentary on the importance of managing risk in this great economic expansion with strong company profits – aided by the Republican tax cuts. Investors who just buy companies whose share prices are setting all-time record highs pass as financial geniuses. However the earnings outlook, in our opinion, has gotten a bit too rosy. Wall Street optimism has markets priced for perfection, and with many market-leading stocks trading at levels inconsistent with past earnings cycles. And more experienced investors should know that bull markets do not die on pessimism. Our challenge is to convince our readers and investors that investing in a portfolio of blue-chip stocks today is not a sufficient risk management strategy.
We have used our data resources and statistical software to calculate several risk measures which would behoove all investors to be tracking. Knowing the level of risk contained in your portfolio may be the difference between being simply caught in an unpleasant period of poor returns versus suffering a severe financial accident. As investors rebalance their portfolios, we recommend using the risk techniques described below to create a portfolio that “fits well together”…being ever mindful of the aggregate portfolio beta (systemic risk), portfolio correlation with the market, and total portfolio risk.
Know Your Beta
Beta is one of the many Greek letters employed in investment performance analytics. In layman’s terms, beta is simply the sensitivity of the stock’s returns in question to the movements of the entire market. Calculated from a single-factor regression of the stocks’ returns on the returns for the benchmark, beta is interpreted as the stock’s systemic risk. Therefore, if the Russell 3000 rises +10% over a period and your stock’s beta is 1.3, you can expect the stock to rise +13% during the period. Of course, firm-specific risk will also impact stock returns (the unexplained or residual returns from the regression), which we will measure with the standard deviation of returns (see below).
We calculate the 15-year beta of all our positions using weekly return data. By taking the weighted average (position weight times its beta) beta for our portfolio, we have a good idea how our portfolio is likely to react to a given move in the Russell 3000. When an investor believes that the broad market is set to rise, it makes sense to construct a portfolio with a beta superior to 1.0 (a beta of 1.0 corresponds to the systematic risk of the entire market). In all likelihood, the portfolio will beat the benchmark. Conversely, if an investor is bearish, he/she should construct a portfolio with a beta inferior to 1.0. Should the broad market fall, the portfolio will tend to hold up relatively better than the Russell 3000.
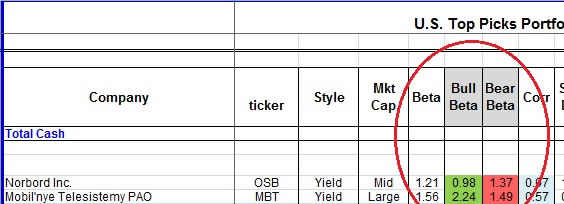
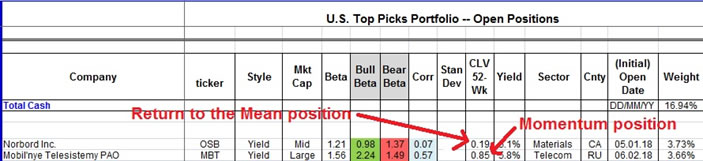
We take our beta calculations a step further and calculate the bull beta and bear beta for our 4000 stock universe. The bull beta looks at the sensitivity of the stock returns to the Russell 3000 in up-weeks, while the bear beta measures the sensitively of returns to the benchmark in down-weeks. A stock with a bull beta greater than 1.0 and a bear beta less than 1.0 would be an investor’s delight (these stocks typically have a high alpha, or non-market return). Unfortunately, in reality, betas tend to rise is periods of market turbulence such that bear betas tend to be greater than bull betas. Nevertheless, in relative terms, it makes good sense to orient your portfolio to stocks with comparatively lower bear betas if you anticipate a bear market in equities. In the same vein, after a bear market, we would look for stocks with comparatively higher bull betas to capture more upside in rally.
Norbord, one of our holdings, a Canadian international producer of wood-based panels, has a beta that increases during periods of market volatility. However the shares of Mobil’nye, a Russian mobile telecommunications provider, have actually tended to fall relatively less in periods of market volatility – its bear beta is lower than its bull beta.
The key take-away here is that all investors need to quantify their portfolio beta. If you are extremely risk-averse and seeing your account lose -20% of its value would cause an ulcer, you need to get your beta well under 1.0. If you are a risk-taking investors and can stomach market swings, running a portfolio with a beta well over 1.0 would be appropriate.
Portfolio Construction Is All About Diversification
Those investors who fell in love with technology stocks in the late 1990s and stuffed their portfolios full of hot tech names learned an expensive lesson in diversification. Buying a bunch of stocks that are highly correlated to the same index (the Nasdaq in this case) offer no protection in terms of volatility reduction. A simple way to reduce portfolio risk is to add securities to your portfolio that have a low (or negative) correlation coefficient with the other securities currently in your portfolio. If you want to know if the securities in your portfolio fit together in a Modern Portfolio Theory (MPT) context, why not build a bordered covariance matrix with your current holdings?
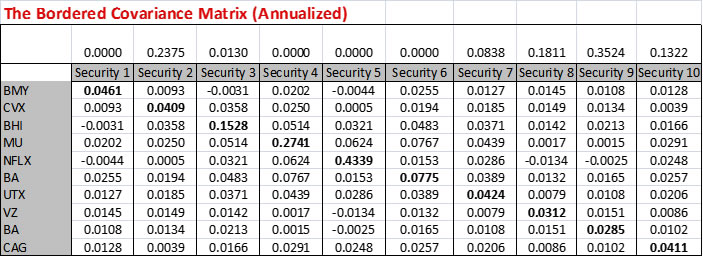
The covariance (COV) relates how two securities move together: a positive COV implies the prices of the two stocks tend to move in the same direction; a negative COV implies the prices tend to move in opposite directions. To standardize the COV into the correlation coefficient (ρ), a measure that ranges from -1.0 (perfectly negative correlated) to +1.0 (perfectly positively correlated), we divide the COV by the product of the two standard deviations:
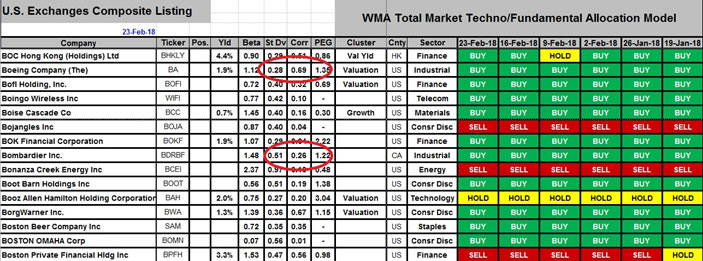
In our Total Market Techno/Fundamental Allocation Model we run each stock’s weekly returns for the past 15 years against the Russell 3000 benchmark returns. Creating a 20-stock portfolio containing securities each with a coefficient correlation greater than 0.75 with the Russell 3000 will result in a high volatility (high risk) portfolio. This will prove to be suboptimal portfolio construction the day U.S. indexes extend into a full bear market. Rather, seek out securities that are de-correlated with your core holdings. For example, if your portfolio is highly concentrated in U.S. large cap stocks, consider adding a spattering of foreign stocks or mining stocks with a low or negative correlation coefficient with the Russell 3000. Each stock vibrates to a different rhythm – while your Russell 3000-correlated stocks fall, your de-correlated assets may hold steady or even rise.
Boeing (BA) has a 0.69 correlation coefficient with the Russell 3000. Holding Boeing’s stock is very similar to holding the benchmark index. Instead, if you want to buy an industrial in the aeronautic sector, consider Bombardier, which has a 0.26 correlation coefficient. In this case, the low correlation comes from the underlying CAD/USD exposure (Bombardier is a Canadian company with an ADR trading on New York). Indeed, diversifying into non-U.S. stocks with an underlying foreign currency is an excellent way to control for risk in a USD-denominated portfolio.
Bottom line: the more names in your portfolio that have a low/negative correlation coefficient versus the Russell 3000 – in addition to holding securities with low correlations against one another – the more stable your portfolio will be in periods on market turbulence.
Recognize The Location of Your Stock Price
One market price based indicator we find useful is our Close Location Value (CLV) score. When investing in a stock, one should always be aware of where the stock is trading in (at least) its cycle over the past year. We calculate the 52-week CLV for each of our 4000 stocks. In this case, the CLV takes the lowest low over the past 52-weeks as well as the highest high and situates the current market price within this range. For example, General Mills (GIS) current CLV is 0.09. The stock’s 52-week high was $60.20, the low $49.69 and the most recent close $52.98. With the price just about equidistant from the high and low, the CLV takes on a value close to 0. If General Mills closed at $60.20, the CLV would be +1.0. If General Mills closed at $49.69, the CLV would be -1.0.
So how can you use the CLV to help manage risk in your portfolio? Whenever you add a new stock to your portfolio, you are implicitly making one of two calls: return to the mean or momentum. If you buy a stock with a 52-week CLV below 0, you are anticipating that stock is ready to reverse higher and extend into the upper end of the 52-week range. Conversely, buying a stock with a CLV at 0.95, well, you are acting as a pure momentum player, betting that new 52-week highs will be set in the near-term. First rule of portfolio management, don’t be hitting only on either momentum stock, nor on only return to the mean stocks. Strong profit taking in momentum stocks could leave your portfolio victim to an air pocket while holding return to the mean stocks may take a very long time to pan out (with more loses in the intermediate term – just ask investors in materials stocks today).
Second rule, if you are buying stocks with a CLV below 0, recognize that you are buying on weakness. While we like buying stocks with a CLV below 0, due to a greater upside potential, we remain very aware to the near-term trend. Buying a low CLV stock that is still falling is a low-probability bet (bottom picking). We prefer waiting and buying low CLV stocks that are already rising.
Anticipate How Your Stocks Will Swing
While beta (above) measures systematic or market risk, total risk (market risk + firm-specific risk) is measured by a stock’s standard deviation. We calculate the annualized standard deviation for each of our 4000 stocks over the past 15 years. The first job of a portfolio manager is to act as a risk manager. If you buy stocks because they are rising and you consciously or unconsciously take on more risk than you should, the gods of the stock market will strongly disapprove….and they’ll let you know! There is nothing wrong with buying high volatility stocks – after all they offer higher expected returns. However not keeping a tab on your total portfolio’s weighted standard deviation is just an amateur mistake that you’ll pay for in the school of hard knocks.
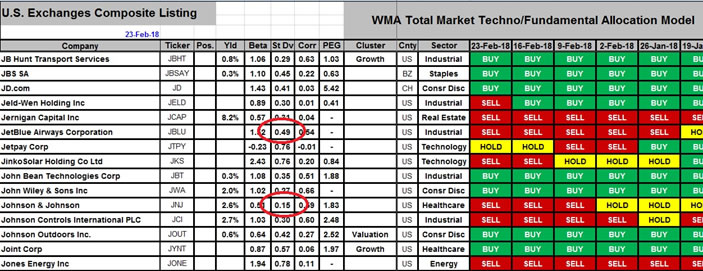
Concretely, the standard deviation (σ) is the second moment of a probability distribution, measuring the dispersion around the mean (or the stock’s annual expected return). For example, if the expected return on JB Hunt Transport is 15% for 2018 and the standard deviation is 29%, then 1 σ would imply a potential range of +44% to -14% for 2018. Assuming returns are normally distributed for the stock, 1 σ encompasses 68% of the observations, meaning that there is a 68% chance that JB Hunt’s 2018 return will fall anywhere between +44% and -14%. Of course this is just the most likely scenario…investors are always exposed to tail risk (an outcome in excess of 3 σ).
Most investors know that Johnson & Johnson (JNJ) is much less risky than a cyclical company like JetBlue Airways (JBLU). But just how much riskier is JetBlue? As shown below, the standard deviation of JNJ is 15% compared to 49% for JBLU. So yes, JBLU is over 3x riskier than JNJ.
Don’t Overpay For Growth
The price-to-earnings growth ratio (PEG), while not a risk measure per say, is particularly important in today’s market we feel, where valuations seem to be losing touch with reality (the PEG is calculated as the ratio of P/E to the firm’s earnings growth rate). The PEG ratio was popularized by Peter Lynch (former manager of the Magellan Fund), who judged a company’s stock to be “fairly valued” if the P/E ratio was equal to the growth rate of the company’s earnings. That is, a stock trading at 15x forward earnings with a forecasted 15% growth rate would be “correctly” priced (PEG ratio equal to 1.0). Lynch focused his portfolios on companies trading at a P/E inferior to the earnings growth rate (eg undervalued stocks).
We believe that the PEG ratio can serve as a proxy for risk in growth stocks whose price has run up over the past year. For companies whose P/E ratios remain in-line with earnings growth rates, we would have to assume that their stock would not be sold-off as aggressively in a equity bear market, relative to a stock whose P/E is disproportionately higher than the company’s growth rate.
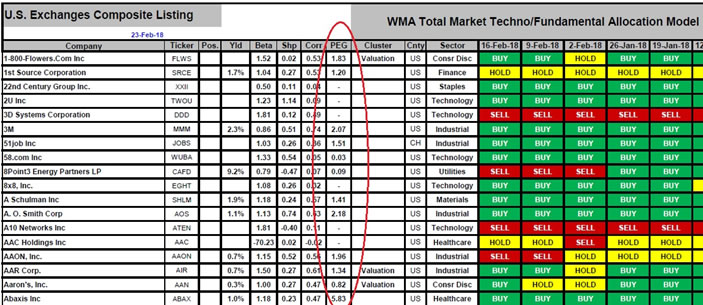
We use the PEG ratio as one of the criteria in selecting “growth stocks” among the 4000 companies in our investment universe. We are also publishing our PEG ratio for investors wishing to evaluate potential stocks for their portfolio. On our Total Market Techno/Fundamental Allocation Model, the PEG ratio shown is calculated from a composite growth rate which we do in-house:
- Consensus Y/Y Sales Growth Rate
- Consensus Y/Y EPS Growth Rate
- Consensus Forecast of Operating EPS Long-Term (3 to 5 Years) Growth Rate
The numerator uses an average of the consensus estimate P/E for the current year and the consensus estimate P/E for next year. The accuracy of the PEG ratio depends on the inputs used -- using historical growth rates gives a rear-view mirror perspective. This is why we compile the data to create a forward-looking composite growth rate.
How does an investor use our PEG ratio? We recommend short-listing stocks for your watch list with PEG ratios no greater than 1.50 (and preferably below 1.00). For companies with a negative composite WMA growth rate or companies with a PEG exceeding 10.0, we replace the score with a “-” and exclude the stock from consideration.
Bottom line: simply not overpaying for earnings and sales growth is in itself a risk management technique.
Conclusion
Our U.S. Composite Market Risk Indicator has remained in the “Risk-On” mode for 25 consecutive months. Markets go through cycles of Risk-On and Risk-Off. We appear overdue for a period of Risk-Off. Stay invested but with greater attention towards the risk that you are taking. Using our above risk measures will help keep your portfolio afloat even if equity markets hit a prolonged soft patch.
By Williams Market Analytics
http://www.williamsmarketanalytics.com
We provide insightful market analysis and account management founded upon our very successful systematic, disciplined approach to investing. Our investment analysis revolves around two inputs: company valuation and our quantitative, market-based indicators. Learn more about our approach and our strategist.
© 2018 Copyright Williams Market Analytics - All Rights Reserved
Disclaimer: The above is a matter of opinion provided for general information purposes only and is not intended as investment advice. Information and analysis above are derived from sources and utilising methods believed to be reliable, but we cannot accept responsibility for any losses you may incur as a result of this analysis. Individuals should consult with their personal financial advisors.
© 2005-2022 http://www.MarketOracle.co.uk - The Market Oracle is a FREE Daily Financial Markets Analysis & Forecasting online publication.