


World Stock Market Indices Have Much More Upside
Stock-Markets / Global Stock Markets Oct 13, 2017 - 11:10 AM GMT

 The Hang Seng Stock Index is a free float, adjusted market capitalization, weighted stock Market Index in Hong Kong. The Index records and monitors daily changes of the largest companies of the Hong Kong Stock Market. It is the main indicator of the overall market performance in Hong Kong. These 50 constituent companies represent about 58% of the capitalization of the Hong Kong Stock Exchange. At Elliottwave-Forecast, we have been tracking the Index sequences together with the FTSE 100 (The Financial Times Stock Exchange 100 Index). FTSE 100 is the share Index of the 100 companies listed on the London Stock exchange with higher market capitalisation.
The Hang Seng Index and FTSE 100 both are showing the same sequences since the all-time lows and both are showing an incomplete sequence since the lows at 2008-2009 range. Today, the Market today can advance in 2 types of sequences. The first type is 5-9-13 or motive sequence and the second type is 3-7-11 or corrective sequence. Both the Hang Seng Index and the FTSE 100 advance in a corrective sequence and both have not reached the 100% from all-time low.
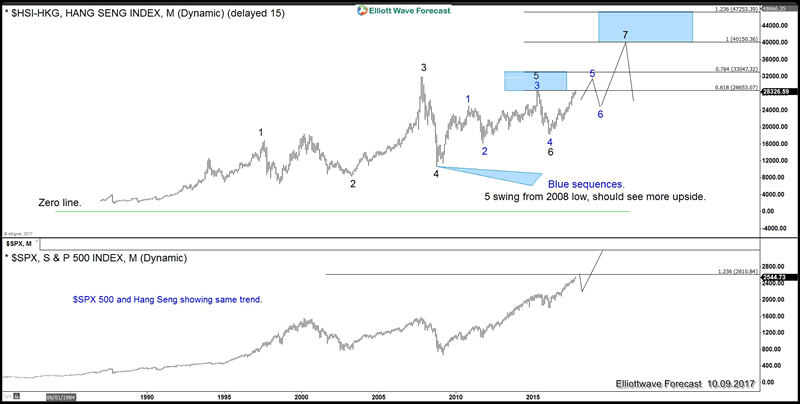
The Market by nature will always runs in one of the 2 sequences above. Both Hang Seng and FTSE 100 are showing the same outcome which is an extension to the upside within the cycle since 2008-2009 low. The charts below show the extension target in both indices, and the upside in both indices will drive the rest of the World Indices higher. This means that SPX 500 (The Standard & Poor’s 500), which is the market capitalizations of the 500 large companies in the United States, has scope to rally into levels which not many people are expecting such as 3245 or even the 4000 levels.
The rally in SPX 500 from all-time low can become a 5 waves impulse if SPX 500 can break above 3245 before the Hang Seng and FTSE 100 reach the 100% from all time low and finish the blue sequence as charts below show. At the end of the day, the world indices are here to extend and contrary to many popular street opinion, they will remain a buy in the dips in all time frames until Hang Seng and FTSE 100 reach their target.
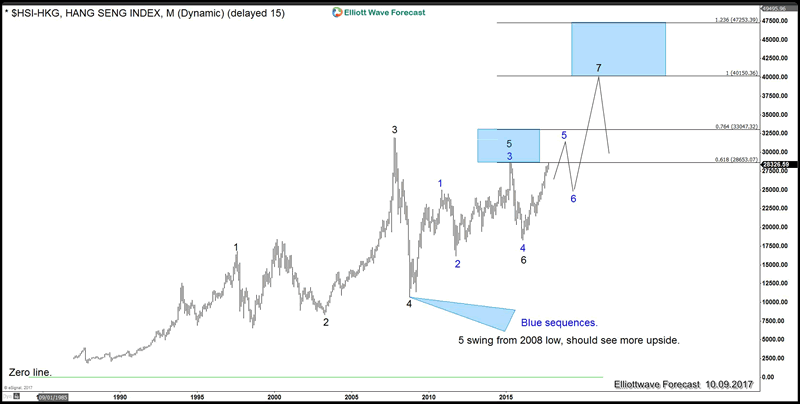
Hang Seng Stock Index Monthly and Weekly
The Hang Seng Index is showing 5 swings from 2008 lows, which should result in more upside within the blue sequence into the all time 100%. The invalidation for this view in daily degree is the blue 4 low (18278.80) while the invalidation in weekly degree is the black 4 low (10676.29).
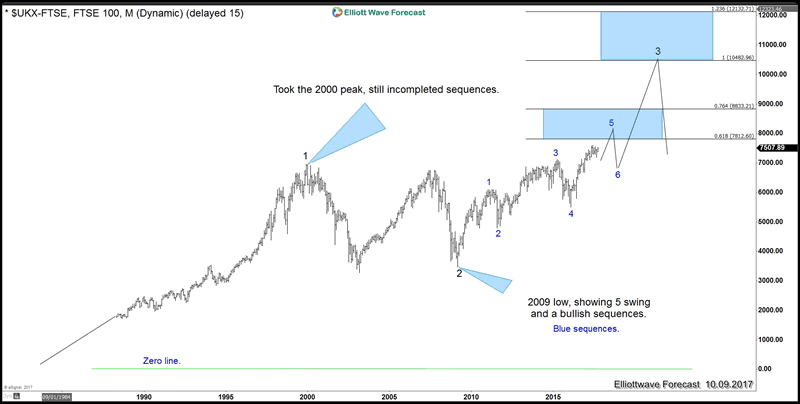
FTSE 100 Stock Index
The Index took the 2000 peak, which suggests the bullish sequence from all-time lows is incomplete. In addition, we could also see 5 swing bullish sequence in blue degree from 2009 low, which favors more upside.
The following chart below shows that both Hang Seng and SPX 500 have the same trend
At Elliottwave-forecast, we believe that there’s only one Market. Having 2 Indices calling more upside mean the whole group will trade higher. We believe in cycles, distribution and many other tools in addition to the classic or new Elliott wave Principle. To get regular update on the market and Elliott wave charts in 4 time frames, try EWF 14 days for only $9.99.
By Ayoub Ben Rejeb
https://elliottwave-forecast.com
ElliottWave-Forecast has built its reputation on accurate technical analysis and a winning attitude. By successfully incorporating the Elliott Wave Theory with Market Correlation, Cycles, Proprietary Pivot System, we provide precise forecasts with up-to-date analysis for 52 instruments including Forex majors & crosses, Commodities and a number of Equity Indices from around the World. Our clients also have immediate access to our proprietary Actionable Trade Setups, Market Overview, 1 Hour, 4 Hour, Daily & Weekly Wave Counts. Weekend Webinar, Live Screen Sharing Sessions, Daily Technical Videos, Elliott Wave Setup .
Copyright © 2017 ElliottWave-Forecast - All Rights Reserved Disclaimer: The above is a matter of opinion provided for general information purposes only and is not intended as investment advice. Information and analysis above are derived from sources and utilising methods believed to be reliable, but we cannot accept responsibility for any losses you may incur as a result of this analysis. Individuals should consult with their personal financial advisors.
© 2005-2022 http://www.MarketOracle.co.uk - The Market Oracle is a FREE Daily Financial Markets Analysis & Forecasting online publication.