


Stock Market Institutional Investment Flows Matrix
Stock-Markets / US Stock Markets Aug 21, 2008 - 04:11 PM GMTBy: Marty_Chenard

 There are two things all investors must do in order to understand the market and be proficient at technical analysis.
What are the two things?
1. Understand charting, technical indicators, and how to read them.
2. Have an excellent, daily view of " underlying fundamental market conditions " that shows what kind of muscle is under every market movement and how those fundamentals may be shifting.
I haven't shared this study and matrix with you before, but today I will. What you will see below are matrix-charts that we post at the beginning of our daily paid subscriber analyses every day. The matrix is gives investors a quick view of what is happening "underneath all the noise" in the market.
There are 9 underlying fundamental market conditions that we measure every day, and we color code their condition along with a 3 day view so that investors can see any change in trending.
We know that sometimes, investors are too busy to read all the 25 to 35 charts and analyses we post every day. Our subscribing Hedge Fund, Mutual Fund, and Money Managers have the time to do so because that it their job. For others, it is sometimes nice to be able to see a daily barometer of conditions like you will see today.
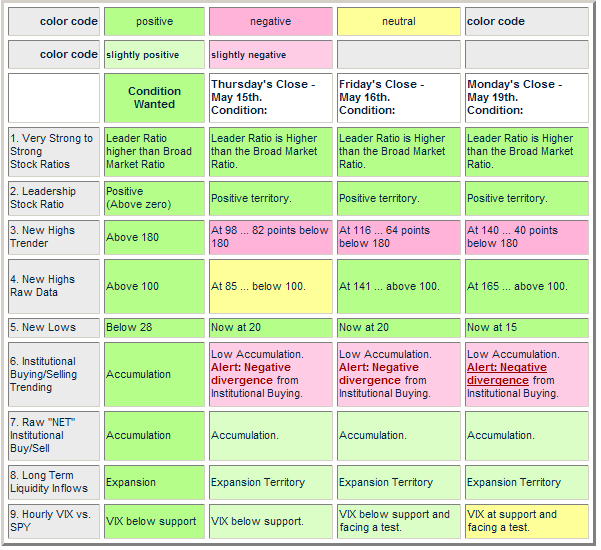
The matrix below was posted on May 19th. of this year. That was an important date because that was the last market peak before the correction started. I won't go into detail about each of the 9 fundamentals because that is covered in Section 4 of our daily subscriber updates.
Take a moment to look at the Matrix below. It is color coded showing the shift of each condition over a 3 day period. This matrix shows what happened on the peak market day and the two days before. Conditions were mostly positive, but there were warning signs on two indicators ... and one of them was showing an " Alert: Negative Divergence ". What is important, is what happened in the two days afterwards as you will see in the next chart.
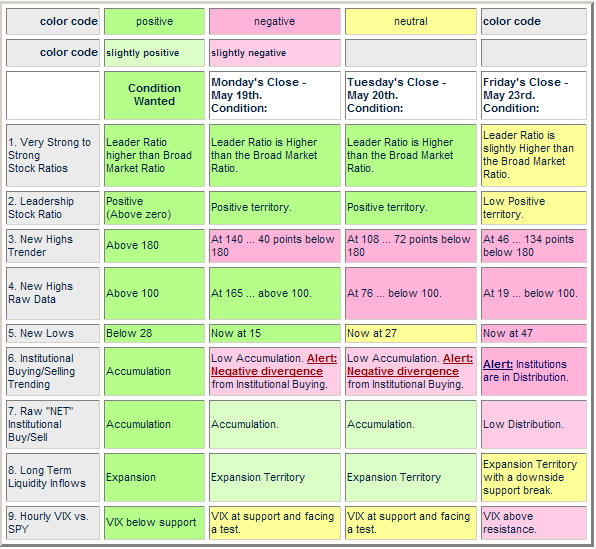
Here, you can see May 19th.'s data and what happened during the two next days.
Don't even read the information yet ... just glance your eyes at the chart and see what is happening to the shift in color codings .
You should be able to quickly observe two things:
1. The day after May 19th., 3 red conditions showed up ... and two days after, there were 6 red conditions and all the green market conditions had disappeared.
That would have warned you that underlying fundamental support conditions were deteriorating and going negative.
Also, if you look at # 6 and #7 on the matrix, you will see that Institutional Investors went into Distribution on May 23rd . What would you have done if you had seen this data last May?
See the next chart ...
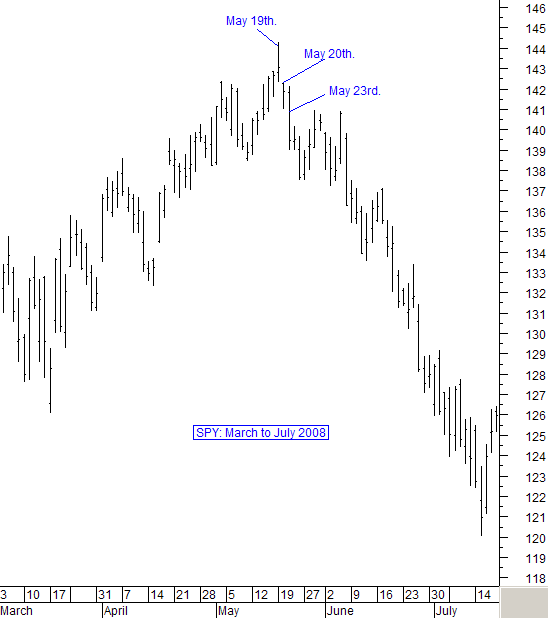
In case you don't remember May 19th., here is the S&P's SPY ETF chart for the market action during that time period. Note how the SPY went into a correction as its underlying fundamentals deteriorated. (We post and email this matrix to our subscribers every morning.)
We hope that you have found today's information useful and an incentive to building your own set of underlying fundamentals to be used with your daily charts and trading.
*** Feel free to share this page with others by using the "Send this Page to a Friend" link below.
________________________________________________________________________
By Marty Chenard
http://www.stocktiming.com/
Please Note: We do not issue Buy or Sell timing recommendations on these Free daily update pages . I hope you understand, that in fairness, our Buy/Sell recommendations and advanced market Models are only available to our paid subscribers on a password required basis. Membership information
Marty Chenard is the Author and Teacher of two Seminar Courses on "Advanced Technical Analysis Investing", Mr. Chenard has been investing for over 30 years. In 2001 when the NASDAQ dropped 24.5%, his personal investment performance for the year was a gain of 57.428%. He is an Advanced Stock Market Technical Analyst that has developed his own proprietary analytical tools. As a result, he was out of the market two weeks before the 1987 Crash in the most recent Bear Market he faxed his Members in March 2000 telling them all to SELL. He is an advanced technical analyst and not an investment advisor, nor a securities broker.
Marty Chenard Archive |
© 2005-2022 http://www.MarketOracle.co.uk - The Market Oracle is a FREE Daily Financial Markets Analysis & Forecasting online publication.