US Dollar Acceleration Phase is Dead Ahead!
Stock-Markets / Financial Markets 2017 Jun 14, 2017 - 01:03 PM GMTBy: Enda_Glynn
 My Bias: LONG
Wave Structure: rally in wave [C]
Long term wave count: wave [C] is underway, upside to above 136.00
Important risk events: JPY: N/A. USD: CPI m/m, Retail Sales m/m, Crude Oil Inventories, FOMC Statement, Federal Funds Rate, FOMC Press Conference.

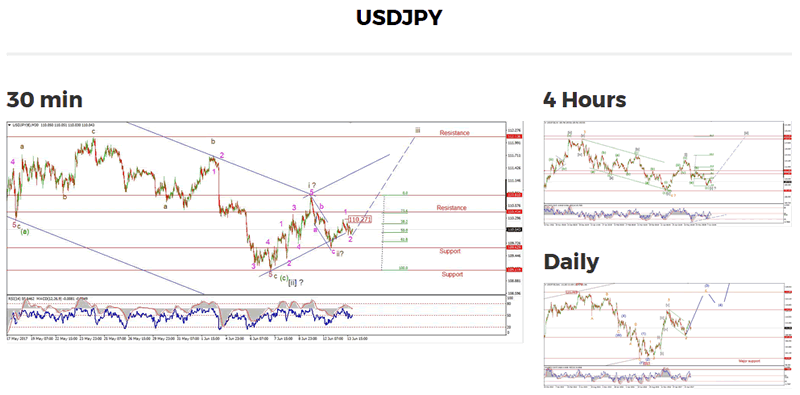
USDJPY continued its impulsive move to the upside today in what may be the beginning of wave 'iii' brown.
This evenings slide looks corrective and is in three waves at the moment.
I have labelled todays action as wave '1' and '2' in pink.
Looking across the three USD cross rates that I follow in the nightly analysis I can see a common theme.
That is; A Dollar acceleration phase is dead ahead!
In USDJPY, that should come in the form of wave '3' of 'iii' of (i) of [iii]
Now thats a mouthful!
yesterdays low of 109.62 id the short term support/ invalidation line.
This level needs to hold from here.
The 4hr momentum is also looking bullish where we are on the verge of MACD and RSI bullish signals.
For tomorrow, watch 110.27 for an upside break.

My Bias: market topping process ongoing
Wave Structure: Impulsive 5 wave structure, possibly topping in an all time high.
Long term wave count: Topping in wave (5)
Important risk events: USD: CPI m/m, Retail Sales m/m, Crude Oil Inventories, FOMC Statement, Federal Funds Rate, FOMC Press Conference.
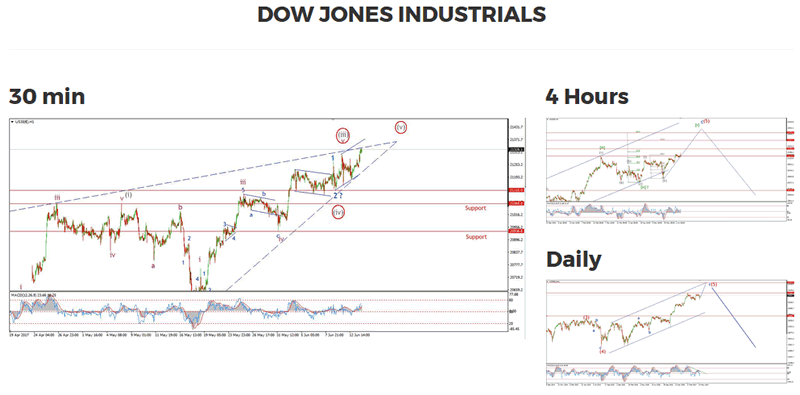
Today price action in the DOW brought another new all time high that is three in the last week.
The action following the previous highs is a little concerning.
Let me explain.
The ending diagonal idea is gaining strength as the days go on.
The contracting price range,
The sudden drops from new highs,
And an ever worsening market internals situation are all pointing to a nearby top.
These sudden drops are a symptom of cascading disbelief in the rally.
One trader sells the new high and a slew of traders follow.
Remember;
This market is built on self reinforcing rallies at this stage,
Where people believe the price will rally because the price is rallying!
And so they buy, because the price is rallying.
Fundamental discounted cash flow valuations have been trashed like last weekends pizza box at this stage!
But that does not mean we cant learn from those fact based time tested methods,
And those methods tell us that the market is overvalued by about 140% above what historical norms would allow
given the discounted future cash flows of the companies within the index!
So;
Valuations tell us that a minimum correction of about 60% is required just to bring the price back into line with long term valuations.
But of course the correction will not stop at a 60% decline!
The price will undershoot valuations significantly before turning up again for the long term.
For the short term,
The rally off the low labeled wave '2' blue is still in three waves,
Which suggests a corrective rise.
If the price meets the trendline and turns down,
then either wave '2' is still completing or the alternate wave count is emerging as the preferred.

My Bias: Long towards 1550
Wave Structure: ZigZag correction to the upside.
Long term wave count: Topping in wave (B) at 1550
Important risk events: USD: CPI m/m, Retail Sales m/m, Crude Oil Inventories, FOMC Statement, Federal Funds Rate, FOMC Press Conference.
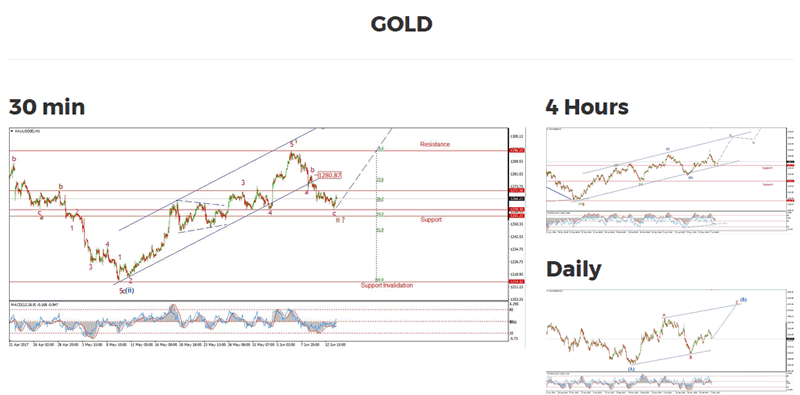
GOLD has popped slightly today off the projected low and support at 1258.
the price reached a low of 1259.13 and has risen encouragingly in the afternoon trade.
The first resistance lies at 1271, the low marked wave 'a' pink.
A break of that level and the formation of a higher low will signal a turn up is likely form here.
The 4hr RSI has turned up again forming a bullish higher low of the extreme low last month.
Another bullish momentum signal is on the cards in the coming days.
When I look at the COT data, I can see that open interest has flat lined and bullish positions are building again.
So the appetite is there for a rally to commence.
For the next couple of days I have my eyes firmly fixed on 1280.87, the previous wave 'b'.
An impulsive break of that high will set the structure up for run higher in wave 'iii'.
Corrections have plagued this market of late.
Thats about to change!
Enda Glynn
http://bullwaves.org
I am an Elliott wave trader,
I have studied and traded using Elliott wave analysis as the backbone of my approach to markets for the last 10 years.
I take a top down approach to market analysis
starting at the daily time frame all the way down to the 30 minute time frame.
© 2017 Copyright Enda Glynn - All Rights Reserved
Disclaimer: The above is a matter of opinion provided for general information purposes only and is not intended as investment advice. Information and analysis above are derived from sources and utilising methods believed to be reliable, but we cannot accept responsibility for any losses you may incur as a result of this analysis. Individuals should consult with their personal financial advisors.
© 2005-2022 http://www.MarketOracle.co.uk - The Market Oracle is a FREE Daily Financial Markets Analysis & Forecasting online publication.


