


Bonds, Dollar, Stocks, Gold, Silver Major Markets at Turning Points
Stock-Markets / Financial Markets 2017 Jan 19, 2017 - 04:21 PM GMTBy: DeviantInvestor

 Bonds have risen in a 35 year bull market. That bull market looks tired and probably peaked in July of 2016.
The U.S. Dollar Index recently hit 14 year highs. Has the dollar finally peaked? Has it turned downward since January 3, 2017?
Stocks have been rising since the 2009 crash lows. Rounded to the nearest point, the Dow hit 20,000. Was that enough to make a final top before a major turn downward?
Gold made an important low over a year ago but we continually hear chatter about gold falling below $1,000, perhaps to $700 or even $350. I believe it has turned upward and the chatter will dissipate.
Let’s speculate about turning points in these important markets.
T-Bonds:
The global bond market is perhaps $100 trillion. Derivatives tied to interest rates are perhaps another $500 trillion. Yes, these are big numbers and interest rates affect practically everything – student loan debt, consumer spending, sovereign nation borrowing, housing sales, mortgage rates, credit card rates, bank profitability, availability of credit and more.
The global bond market is the largest financial bubble in history. A crash would be important …
Examine this chart of the U.S. T-bond.
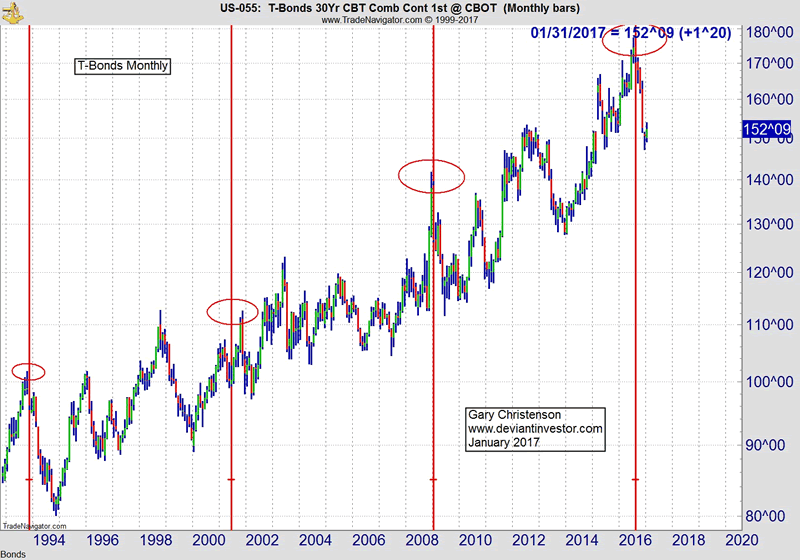
The vertical red lines are spaced 91 months apart – about 7.6 years. The high was last July.
Previous important highs shown at the ovals were close to those 7.6 year cycle peaks.
Since July T-bonds are 25 points off their highs and the 30 year interest rate is nearly a point higher than its multi-decade low. After 35 years this bull market probably has died. A global blood bath in bonds will create a financial version of the holocaust. (A short term bounce looks likely as of January 17, 2017.)
Read Alasdair Macleod: Malice in Wonderland
U.S. Dollar Index
Dollar exchange rates affect everything. Examine this chart.
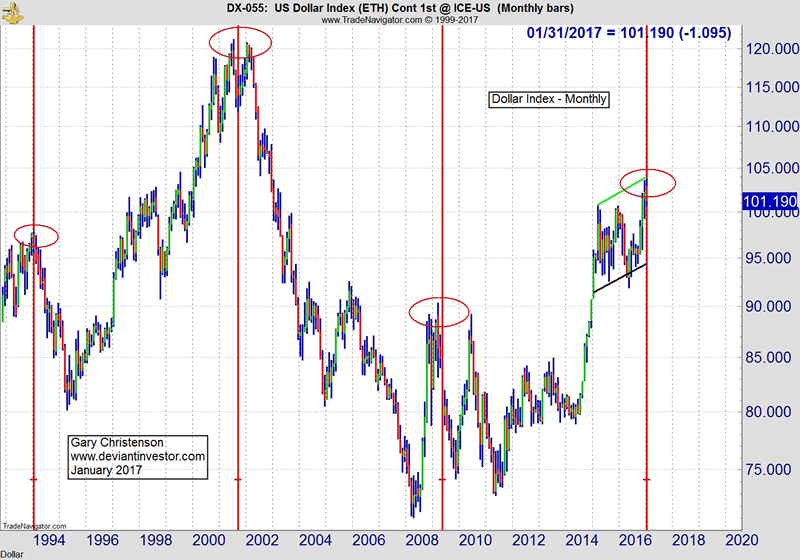
The red lines are spaced 92 months apart, about 7.7 years. Highs shown at ovals occurred close to those vertical red lines, and a cycle high has potentially arrived now. Many people, including myself, thought the peak in March of 2015 was a sustainable high but obviously not. Perhaps the high occurred on January 3, 2017. As of January 17 the index has fallen over 3 points.
SP 500 Index
Stocks have been levitated by central banks, easy and inexpensive debt, massive credit, cheap share buybacks and more. Long-term cycles pointed to a potential top halfway through 2015, but central bank levitation won out. Stocks could turn here or delay a crash for several more months, perhaps as Charles Nenner suggests, until October 2017. Watch out if the S&P breaks the black support line rising through 2,000.
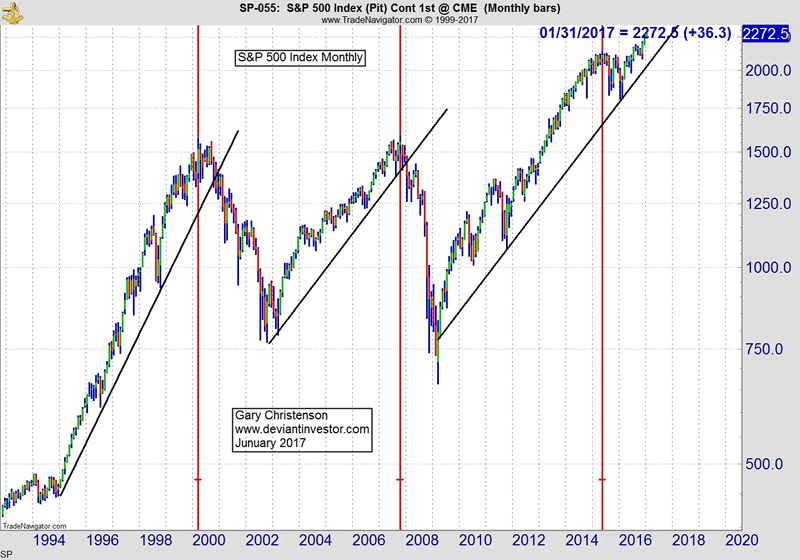
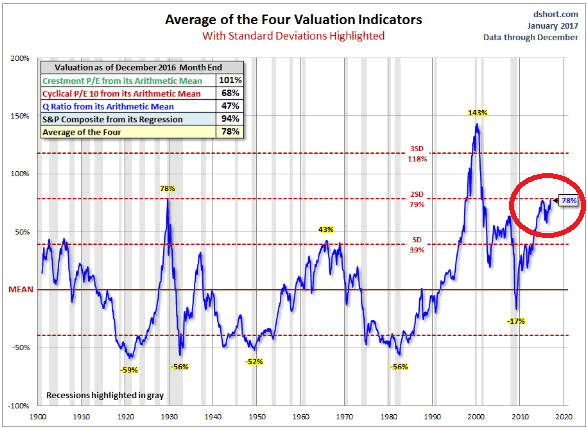
From Steve Saville:
“… based on an average of four valuation indicators the S&P 500’s valuation for today is the same as it was at the 1929 peak and second only to the 2000 peak.”
Timing and valuation agree – this market is too high and ready to run lower.
Gold
Gold prices bottomed in December 2015 unless you believe that deflation or a “black swan” event will crash all markets in the near future. The following chart makes a strong case for a gold bottom over a year ago. Ratios comparing gold to debt, the S&P, the DJIA and M2 also suggest that gold already hit a significant bottom. More importantly those ratios suggest that gold should rally substantially from here.
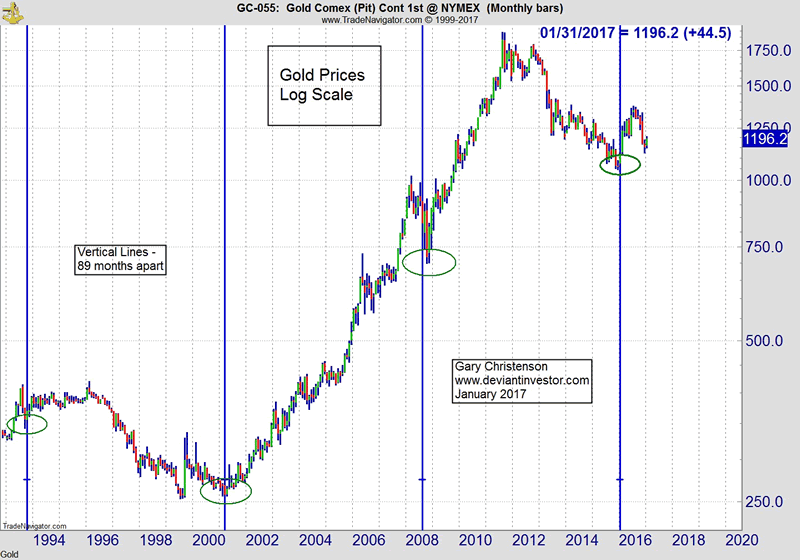
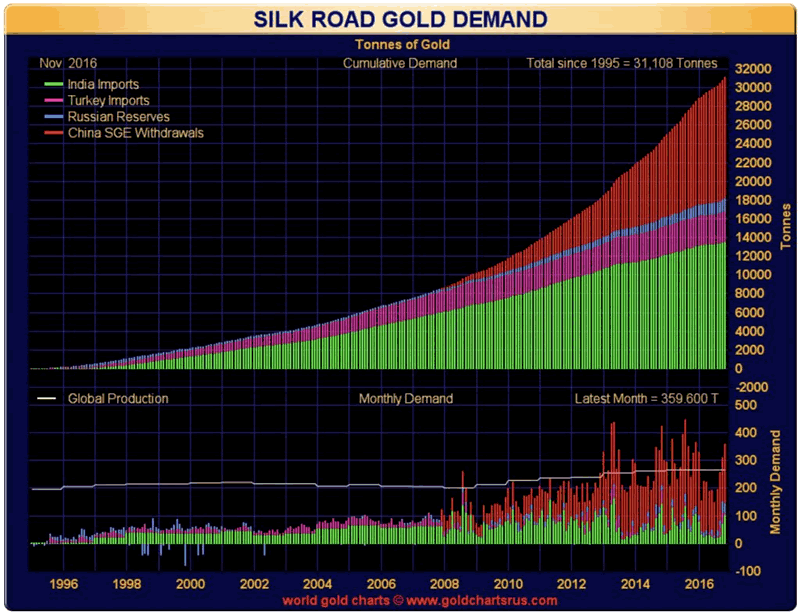
Thousands of metric tons of gold have been imported into Asia, from western vaults. Asians wisely prefer physical metal rather than paper and debt – a sensible perspective.
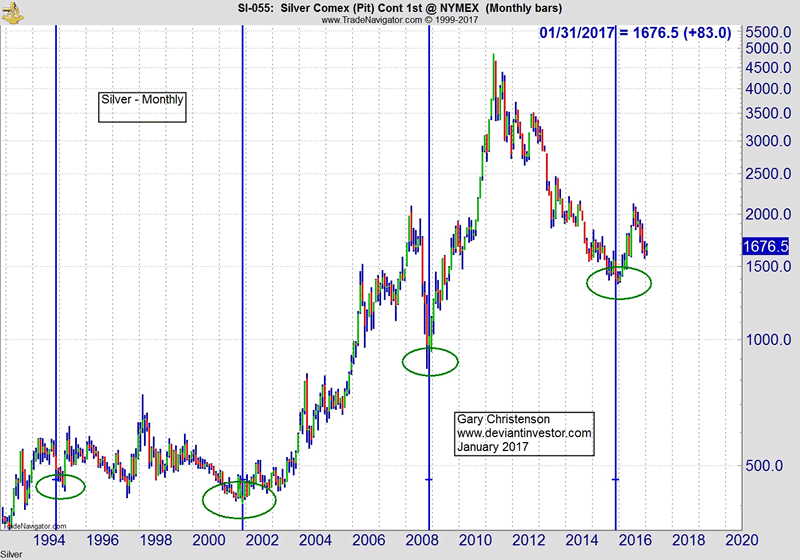
Silver:
Silver charts tell the same story as gold. Higher highs are ahead.
Quick Summary:
T-bonds, the dollar index and the S&P are debt based paper assets. They appear to be slightly past, at, or approaching very long term tops. Paper assets based on dodgy debt and excessive leverage look toppy and highly risky for 2017.
Question: What if all three major markets – bonds, the dollar and the S&P 500 – have topped, or will quite soon? What does that suggest could happen during the next four years?
Gold and silver are real assets but without the counter-party risk that devastated many individuals, hedge funds, and traders during the crisis of 2008. Another crisis could happen again, perhaps as soon as the week following Inauguration day.
Dodgy paper debts
or
physical metals that have retained their value for over 3,000 years? Hmmmmm! The choice should be easy.
All the best
Gary (for Rambus Chartology)
FREE TRIAL - http://rambus1.com/?page_id=10
© 2016 Copyright Rambus- All Rights Reserved
Disclaimer: The above is a matter of opinion provided for general information purposes only and is not intended as investment advice. Information and analysis above are derived from sources and utilising methods believed to be reliable, but we cannot accept responsibility for any losses you may incur as a result of this analysis. Individuals should consult with their personal financial advisors.
© 2005-2022 http://www.MarketOracle.co.uk - The Market Oracle is a FREE Daily Financial Markets Analysis & Forecasting online publication.