


Stock Market Liquidity Which Way Will it Break?
Stock-Markets / US Stock Markets Aug 05, 2008 - 02:00 PM GMTBy: Marty_Chenard

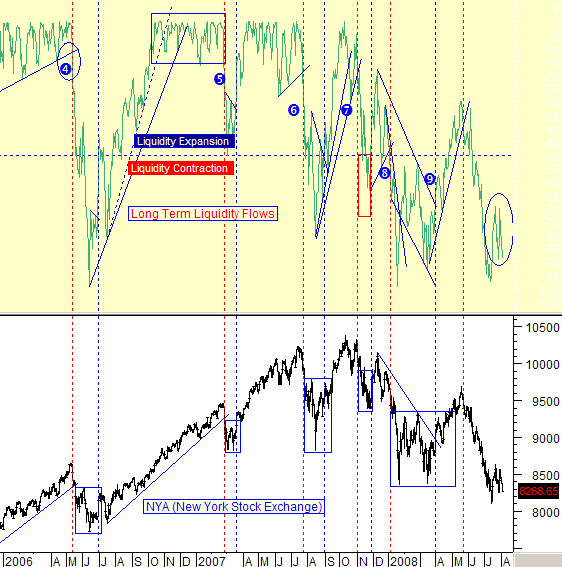
 Today's charts show the inflows and outflows of liquidity into the stock market. When inflows are trending up and positive (in expansion), the competition for stocks becomes high and prices are bid up causing an upside rally.
The opposite happens when we see liquidity outflows and a trending down pattern. When this is happening with outflows in contraction territory , the balance shifts to a selling competition where investors try to get the best price before expectations of lower movement. This causes a condition that ends up in a market correction.
At the end of May, Liquidity inflows started to decelerate when the April/May liquidity up trend had its support line broken to the downside. Liquidity has been in contraction ever since.
What has happened to liquidity inflows and outflows during the past few weeks?
If you look at the circled area on the chart, you will find the action since Mid-July. In the circled area, you will see that the liquidity has remained in contraction territory with a rise ... followed by a higher/low ... followed by a lower high and then by a higher/low yesterday.
That action was setting up the possibility of a triangular pattern at the close yesterday. See the second chart for what was happening at the open this morning.
At 9:37 AM this morning , the Liquidity did bounce from the support confirming a triangular formation.
Triangular formations are a "squeezing formation" because the resistance line drops lower, and the support line rises higher. This squeeze is typically exhibited by higher intra-day volatility in the stock market until a break out of the squeeze occurs.
As an investor, that is what you are waiting for now. An upside breakout on this liquidity squeeze would feed an upside stock market movement as investors bid prices higher. A downside breakout on this liquidity squeeze would cause underbidding by investors as they try to sell holdings.
It is data like this that helps investors "understand what is making the market behave the way it does". Today chart is posted as a courtesy, and can be found every day on our paid subscriber sites.
*** Feel free to share this page with others by using the "Send this Page to a Friend" link below.
If so, simply click on the link below to quickly and easily forward an email link . It is completely private, so we won't even know if you send one. Send This Page To a Friend
By Marty Chenard
http://www.stocktiming.com/
Please Note: We do not issue Buy or Sell timing recommendations on these Free daily update pages . I hope you understand, that in fairness, our Buy/Sell recommendations and advanced market Models are only available to our paid subscribers on a password required basis. Membership information
Marty Chenard is the Author and Teacher of two Seminar Courses on "Advanced Technical Analysis Investing", Mr. Chenard has been investing for over 30 years. In 2001 when the NASDAQ dropped 24.5%, his personal investment performance for the year was a gain of 57.428%. He is an Advanced Stock Market Technical Analyst that has developed his own proprietary analytical tools. As a result, he was out of the market two weeks before the 1987 Crash in the most recent Bear Market he faxed his Members in March 2000 telling them all to SELL. He is an advanced technical analyst and not an investment advisor, nor a securities broker.
Marty Chenard Archive |
© 2005-2022 http://www.MarketOracle.co.uk - The Market Oracle is a FREE Daily Financial Markets Analysis & Forecasting online publication.