


A Closer Look at Our Recent US Employment Numbers
Economics / Employment Dec 13, 2016 - 04:19 PM GMTBy: Rodney_Johnson

 Last week the Bureau of Labor Statistics reported that the U.S. economy created 178,000 jobs – with 156,000 in the private sector and 22,000 in government – which is right in line with the monthly average for 2016.
But let’s dig a little deeper past the headline numbers. For years we’ve argued that there’s more to the story than just the number of jobs created. We want to know, and our economy depends on, how much money people are paid.
To answer that question, years ago we created the Dent Employment Index. It tracks the new jobs created each month by income, and then separates them into twelve buckets that each represent an hourly wage range.
Each bucket contains an equal number of workers in the overall economy, so there are six groups below the median wage and six groups above. When we compare the latest batch of jobs created by income with the spread of existing jobs, it allows us at a glance to see if we’re adding more jobs in higher-paying positions or concentrating work at the low end.
The numbers from November are promising at first glance…
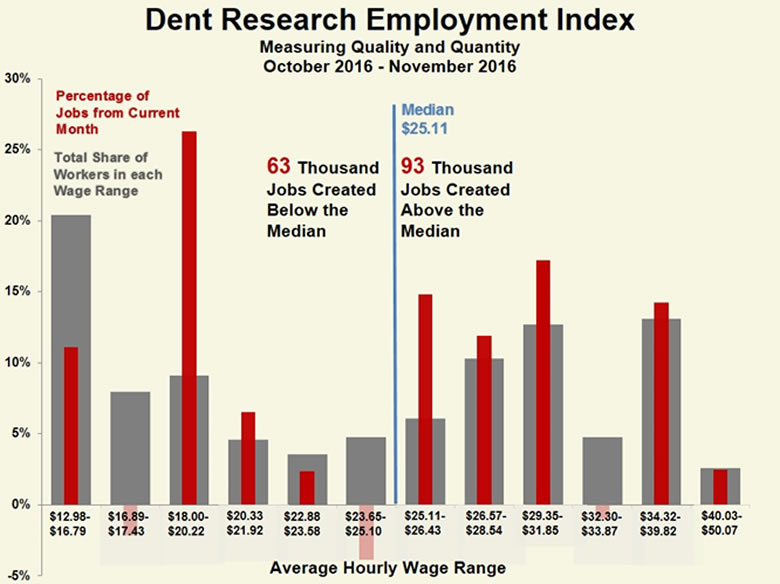
We added more private-sector workers (93,000) above the median wage than below (63,000).
That’s a great result that we should not discount. Even though new jobs aren’t spread evenly across wage buckets, there was a good mix of high and low-paying positions created, with a skew toward the upper end.
But this one month obscures a long-term trend in the jobs market: Middle-class growth is missing.
Compare the monthly chart above with a chart of the last 12 months…
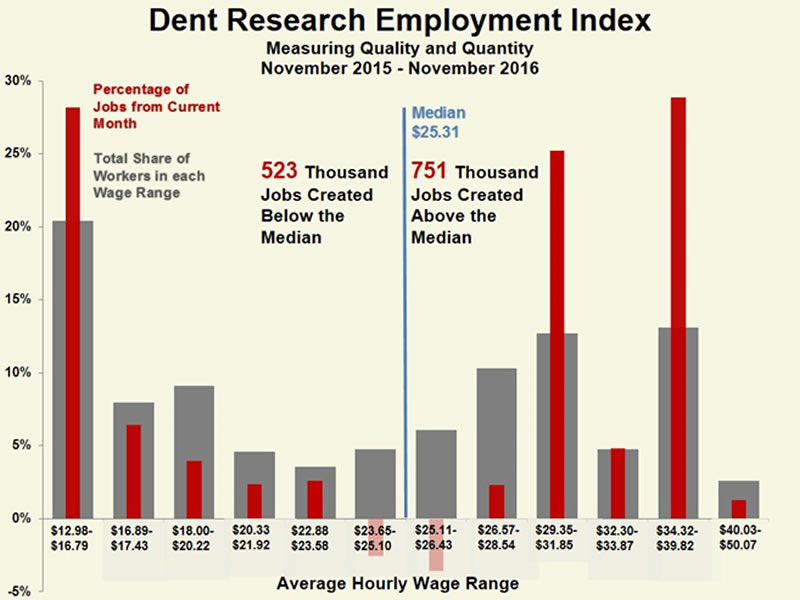
While the numbers still show positive results with more jobs added above the median than below, the middle categories are woefully shy of growth – and jobs below the median are highly concentrated in the lowest bucket of $12.98-$16.79 hourly wages.
A quick glance at the job description table in the BLS report explains the situation. Over the last year, we added a bunch of bartenders, waitresses, and low-end retail employees to the national payroll. These jobs pay low-end wages. For example, on average $14.94 in retail and $12.55 in leisure and hospitality for November.
It could be that many of those new hires are college kids or simply young adults starting out in life. Maybe they’re earning a few bucks on the side as they get their careers in gear.
Or maybe, this is their career. Perhaps we’re filling the employment ranks on the low end with service workers that don’t have much of a path to the middle class, where new jobs are few and far between.
In a broad sense, the employment numbers from last month and the last 12 months are encouraging, as we all want to see more Americans earning higher wages.
Rodney
Follow me on Twitter ;@RJHSDent
By Rodney Johnson, Senior Editor of Economy & Markets
Copyright © 2016 Rodney Johnson - All Rights Reserved Disclaimer: The above is a matter of opinion provided for general information purposes only and is not intended as investment advice. Information and analysis above are derived from sources and utilising methods believed to be reliable, but we cannot accept responsibility for any losses you may incur as a result of this analysis. Individuals should consult with their personal financial advisors.
© 2005-2022 http://www.MarketOracle.co.uk - The Market Oracle is a FREE Daily Financial Markets Analysis & Forecasting online publication.