Institutional "Core Holdings" Warning to Bullish Investors
Stock-Markets / US Stock Markets Jul 29, 2008 - 02:12 PM GMTBy: Marty_Chenard

 We have spoken at length about the importance of Institutional investors vs. the stock market. The key element of importance was the fact that Institutions control well over 50% of any day's typical volume. So, the market follows the trend of what Institutions are doing with their "core holdings".
Investors who trade against the prevailing trend of Institutions are betting that they can produce a profit when Institutions are trading against them.
It is just not sound investing and the odds are that you will always lose money in the long run if you trade in the opposite direction of the Institutional "core holding" trend.
This morning we will show you the current Institutional index chart as of yesterday's close. (We post Institutional charts every day on our paid subscriber sites.)
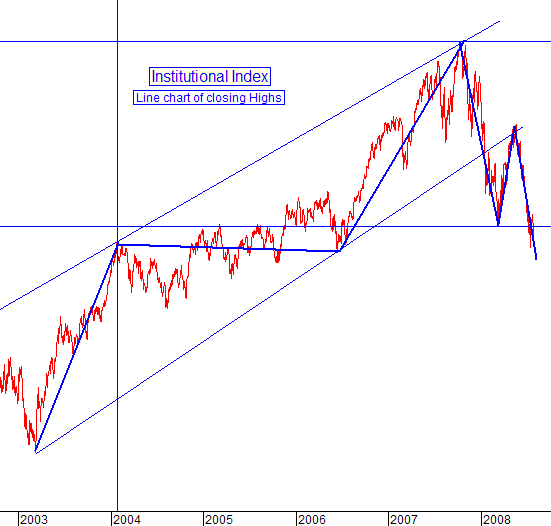
This chart shows the movement of Institutional core holdings going back to 2003.
1. What is clear, is that the Institutional Index moved in a Bullish up channel from 2003 through 2007. 2. Then, in January, the Index fell through the bottom of the channel's support.
3. It then hit dropped until it hit a support line, and rose back up to the resistance on the lower channel.
Since that time, the index failed to the downside, retested the lower support and failed again. It is now below that important support line. Until the Institutional index reverses its trend to the upside, investors would be smart to not play the long side of the market. If preservation of capital means anything to you, follow the trend and direction of Institutional activity.
*** Feel free to share this page with others by using the "Send this Page to a Friend" link below.
If so, simply click on the link below to quickly and easily forward an email link . It is completely private, so we won't even know if you send one. Send This Page To a Friend
By Marty Chenard
http://www.stocktiming.com/
Please Note: We do not issue Buy or Sell timing recommendations on these Free daily update pages . I hope you understand, that in fairness, our Buy/Sell recommendations and advanced market Models are only available to our paid subscribers on a password required basis. Membership information
Marty Chenard is the Author and Teacher of two Seminar Courses on "Advanced Technical Analysis Investing", Mr. Chenard has been investing for over 30 years. In 2001 when the NASDAQ dropped 24.5%, his personal investment performance for the year was a gain of 57.428%. He is an Advanced Stock Market Technical Analyst that has developed his own proprietary analytical tools. As a result, he was out of the market two weeks before the 1987 Crash in the most recent Bear Market he faxed his Members in March 2000 telling them all to SELL. He is an advanced technical analyst and not an investment advisor, nor a securities broker.
Marty Chenard Archive |
© 2005-2022 http://www.MarketOracle.co.uk - The Market Oracle is a FREE Daily Financial Markets Analysis & Forecasting online publication.


