S&P Fails to Break Inverted Head & Shoulders Neckline Resistance
Stock-Markets / US Stock Markets Jul 21, 2008 - 01:22 PM GMTBy: Mike_Paulenoff
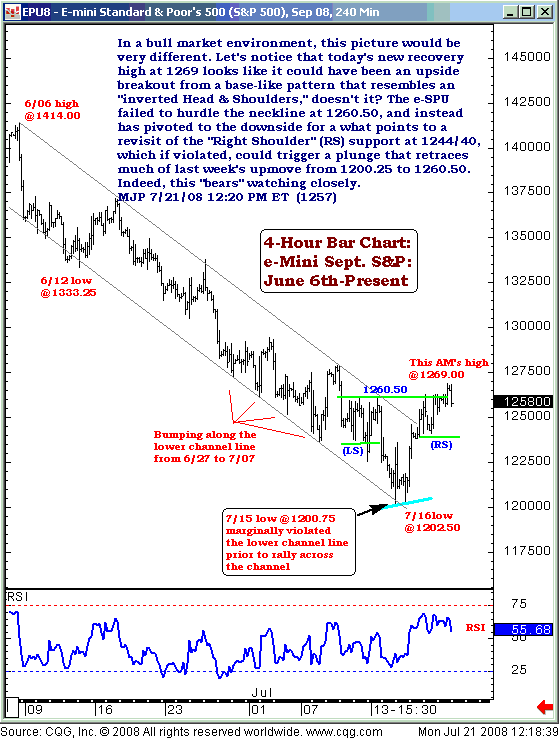
 In a bull market environment, the picture of the S&P 500 & its SPY ETF, as viewed by the e-Mini S&P 500 chart, would be very different. Let's notice that today's new recovery high at 1269 looks like it could have been an upside breakout from a base-like pattern that resembles an "inverted head-and-shoulders," doesn't it?
The e-SPU failed to hurdle the neckline at 1260.50, and instead has pivoted to the downside for what points to a revisit of the "Right Shoulder" (RS) support at 1244/40, which if violated could trigger a plunge that retraces much of last week's upmove from 1200.25 to 1260.50. Indeed, this "bears" watching closely.

Sign up for a free 15-day trial to Mike's ETF Trading Diary today.
By Mike Paulenoff
Mike Paulenoff is author of the MPTrader.com (www.mptrader.com) , a real-time diary of Mike Paulenoff's trading ideas and technical chart analysis of Exchange Traded Funds (ETFs) that track equity indices, metals, energy commodities, currencies, Treasuries, and other markets. It is for traders with a 3-30 day time horizon, who use the service for guidance on both specific trades as well as general market direction
© 2002-2008 MPTrader.com, an AdviceTrade publication. All rights reserved. Any publication, distribution, retransmission or reproduction of information or data contained on this Web site without written consent from MPTrader is prohibited. See our disclaimer.
Mike Paulenoff Archive |
© 2005-2022 http://www.MarketOracle.co.uk - The Market Oracle is a FREE Daily Financial Markets Analysis & Forecasting online publication.


