


Demographics and the Protein Ladder
Economics / Demographics May 08, 2016 - 03:38 PM GMTBy: Richard_Mills

 In 1800, three percent of the world's population lived in urban areas. By 1900, roughly 14 percent of the world's population were urbanites and 12 cities had 1 million or more inhabitants.
In 1950, 30 percent - 746 million people - resided in urban centers and the number of cities with over 1 million people had grown to 83.
In 1975 three cities had populations of 10 million or more. In 1990, there were ten “mega-cities” with 10 million inhabitants or more, which were home to 153 million people or slightly less than seven per cent of the global urban population at that time. Megacities (minimum population of 10 mil to qualify) numbered 16 in 2000.
In 2014, there were 28 mega-cities worldwide, home to 453 million people or about 12 percent of the world’s urban dwellers. Of 2014’s 28 mega-cities, sixteen are located in Asia, four in Latin America, three each in Africa and Europe, and two in Northern America.
By 2014, 54% of the total global population or 3.7 billion people, resided in urban centers. This number is expected to grow to 5 billion by 2030 and double by 2050.
The UN’s DESA Population Division reported that between 2014 and 2050 the largest urban growth, @ 37 per cent, will take place in India, China and Nigeria. By 2050, India is projected to add 404 million urban dwellers, China 292 million and Nigeria 212 million.
China’s rural spending, in 2012, was 2.78 trillion yuan or US$447 billion - less than one-fifth of what urban households spent. Although spending five times more than their rural counterparts urbanites accounted for only 52% percent of China’s population in 2012.
The annual average per capita disposable income in rural China reached 10,489 yuan ($1,693) in 2014. In urban areas, the average per capita disposable income was 29,381 yuan.
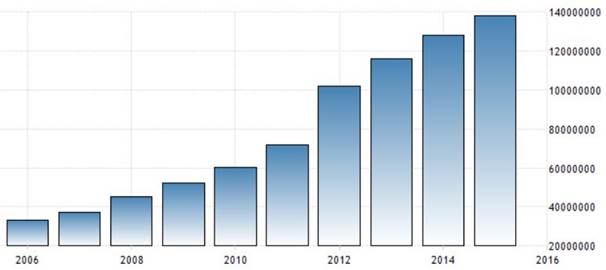
India total disposable personal income, tradingeconomics.com
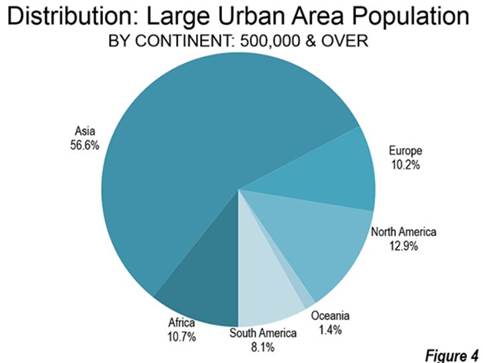
Newgeography.com
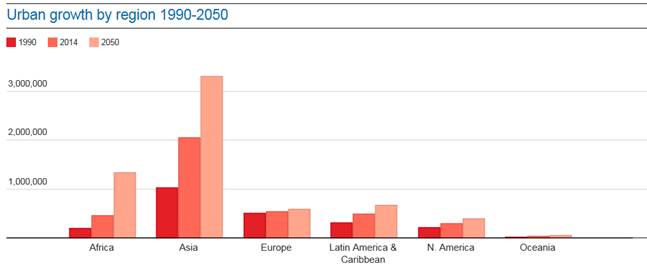
UN Population Division
Almost all urbanization by 2030 will occur in the developing world.
This is a very important development because global discretionary consumption has not only gotten a significant lift from urbanization but this lift is going to continue as hundreds of millions more emerging consumers are going to acquire the means to spend on more than basic necessities.
“The rise of China’s middle class will help lift consumption share in GDP to around 50% by 2030 from 36% in 2014″. ANZ greater China economists Li-Gang Liu and Louis Lam
“If India continues on its current high growth path, India's middle class will swell by more than ten times from its current size of 50 million to 583 million people, incomes will almost triple over the next two decades, and the country will become the world's fifth–largest consumer market by 2025.” McKinsey Global Institute
A rising income means more money in the household budget.
The first thing a newly prosperous middle class urbanite does is change his/her diet.
This change of diet among newly prosperous, urban populations in developing countries is the most important factor stoking the change in global food demand. The new middle class consumers forgo plant based calories in favor of adding more protein from meat and dairy products to their diets. This is called the Protein Ladder, where the ground floor, or basic diet, consists almost entirely of plant matter.
The Protein Ladder:
5.Grain fed beef
4.Grass fed beef
3.Milk, other dairy products
2.Pork
Step 1.Chicken and eggs
Ground Floor = Rice, beans and bread
In 1980, the world ate 133 million tonnes of meat and drank 342 million tonnes of milk.
By 2002, consumption had increased to 239 million tonnes of meat and 487 million tonnes of milk.
“Over the past 50 years, global meat production has almost quadrupled from 78 million tonnes in 1963 to a current total of 308 million tonnes per year. The IAASTD predicts that this trend will continue, especially because the growing urban middle classes in China and other emerging economies will adapt to the so-called western diet of people in North America and Europe with its burgers and steaks.” Globalagriculture.org
The United Nations Food and Agriculture Organization (FAO) estimates that by 2030 global annual consumption of meat will stand at 373 million tonnes and 736 million tonnes of milk.
The FAO estimates that by 2050 global meat production will increase to 455 million tonnes.
The Cost of Climbing the Protein Ladder
The more people there are on this planet and the more Asians, and others, decide they want a western style diet the more grains/oilseeds are needed to feed them. It takes up to 8 kilograms of grain to produce one pound of beef - less for pork, chicken, milk or eggs - between 2kg and 6kg. As meat consumption soars, more grain is needed to feed more livestock.
And many of those very same grains needed to raise the animal protein, the beef, pork and chicken the newly minted middle class wants - are also the very same grains the world’s poorest people, the ones who can’t afford to climb the protein ladder, depend on to survive.
Livestock raising is already the world’s largest user of land resources, with pasture and land dedicated to the production of feed representing almost 80% of the total agricultural land.
If the entire world population were to consume as much meat as the Western world does - 176 pounds of meat per capita per year - the global land required would be two-thirds more than what is presently used.
In 2013, the cattle population reached 1,494 million animals, up 54% from 1963. The number of chickens grown for human consumption increased from 4.1 billion to 21.7 billion between 1963 and 2013. During the same period, the pig population grew by 114% to reach 977 million.
Livestock agricultural reduces the available acreage for direct human grain consumption in two ways:
- The acreage necessary to produce a certain amount of calories from any livestock is drastically greater than the required acreage to produce the same amount of calories from plants
- Livestock agriculture requires additional acreage to grow the grains needed for livestock feed
Currently farmed animals eat one-third of the world’s cereal production. In the industrialized world, two-thirds of the agricultural land produces cereals for animal feed. In the United States, farmed animals, mostly cattle, consume almost twice as much grain as is eaten by the entire US population. Over 100 million acres of US agricultural land is used to grow grain for animals and still more is imported.
The dietary shift from predominantly starch-based food, to meat and dairy, which require more water, is the greatest to impact on water consumption over the past 30 years. Water for irrigation and food production constitutes one of the greatest pressures on freshwater resources.
Producing one kg of rice requires approximately 3,500 liters of water while one kg of beef requires 15,000 liters. Producing that one kg of meat requires as much water as an average domestic household uses over ten months (50l/person/day).
Agriculture accounts for around 70% of global freshwater withdrawals, even up to 90% in some fast-growing economies
Estimates indicate that there will not be enough water available on current croplands to produce food for the expected population in 2050 if we follow current trends and changes towards diets common in Western nations (3,000 kcal produced per capita, including 20 percent of calories produced coming from animal proteins).
Feeding everyone in 2050 could require 50% more water than is needed now.
Conclusion
If everybody on this planet was a vegetarian we could feed 40 billion people.
If everybody ate like the average American we can feed 2.5 billion.
The ‘Father of the Green Revolution,’ Norman Borlaug said: “I now say that the world has the technology - either available or well advanced in the research pipeline - to feed on a sustainable basis a population of 10 billion people.”
The UN’s median population prediction says there will be 9.7 billion of us in 2050.
We aren’t even close to doing everything right agriculture wise. After adding climate change to the mix, it looks like you might want to have a shift in diet on your radar screen.
If not, maybe they should be.
By Richard (Rick) Mills
If you're interested in learning more about the junior resource and bio-med sectors please come and visit us at www.aheadoftheherd.com
Site membership is free. No credit card or personal information is asked for.
Richard is host of Aheadoftheherd.com and invests in the junior resource sector.
His articles have been published on over 400 websites, including: Wall Street Journal, Market Oracle, USAToday, National Post, Stockhouse, Lewrockwell, Pinnacledigest, Uranium Miner, Beforeitsnews, SeekingAlpha, MontrealGazette, Casey Research, 24hgold, Vancouver Sun, CBSnews, SilverBearCafe, Infomine, Huffington Post, Mineweb, 321Gold, Kitco, Gold-Eagle, The Gold/Energy Reports, Calgary Herald, Resource Investor, Mining.com, Forbes, FNArena, Uraniumseek, Financial Sense, Goldseek, Dallasnews, Vantagewire, Resourceclips and the Association of Mining Analysts.
Copyright © 2016 Richard (Rick) Mills - All Rights Reserved
Legal Notice / Disclaimer: This document is not and should not be construed as an offer to sell or the solicitation of an offer to purchase or subscribe for any investment. Richard Mills has based this document on information obtained from sources he believes to be reliable but which has not been independently verified; Richard Mills makes no guarantee, representation or warranty and accepts no responsibility or liability as to its accuracy or completeness. Expressions of opinion are those of Richard Mills only and are subject to change without notice. Richard Mills assumes no warranty, liability or guarantee for the current relevance, correctness or completeness of any information provided within this Report and will not be held liable for the consequence of reliance upon any opinion or statement contained herein or any omission. Furthermore, I, Richard Mills, assume no liability for any direct or indirect loss or damage or, in particular, for lost profit, which you may incur as a result of the use and existence of the information provided within this Report.
Richard (Rick) Mills Archive |
© 2005-2022 http://www.MarketOracle.co.uk - The Market Oracle is a FREE Daily Financial Markets Analysis & Forecasting online publication.