


Gold Price Convincing Upside Breakout Triggering Start of Intermediate Uptrend
Commodities / Gold and Silver 2015 Dec 07, 2015 - 08:49 AM GMTBy: Clive_Maund

 On Thursday the dollar reversed dramatically to the downside and on Friday gold broke out upside, with both developments being predicated by the most bullish gold COTs for 14 years.
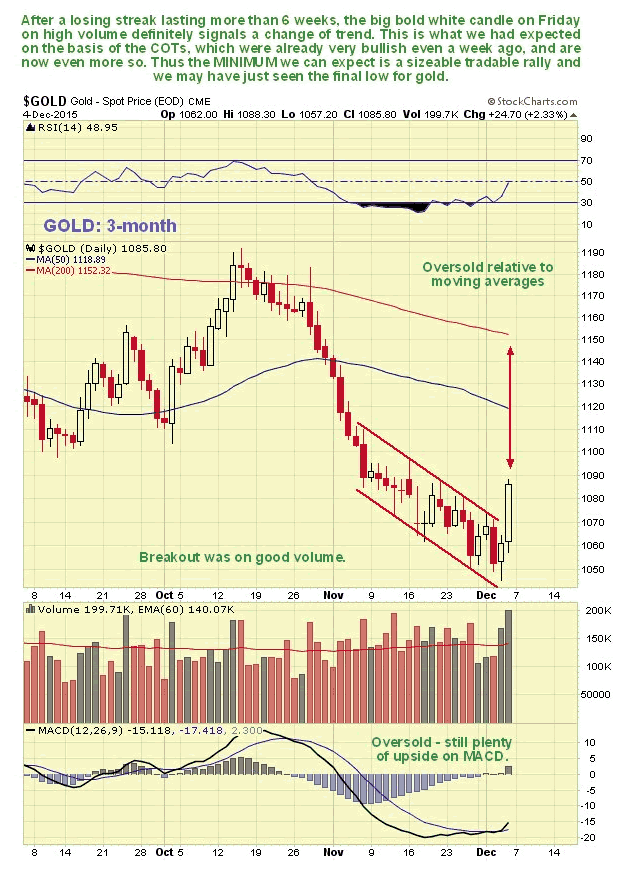
On gold's 3-month chart we can see that, after trying the patience of bulls for weeks as the COT pressure cooker intensified, gold finally broke out on Friday. This was a big decisive breakout on strong volume which COTs indicate is "the real deal". Fortunately the COTs were already so bullish a week ago that we went long ETFs, stocks and Calls before the breakout. As we can see, even after Friday's big move, there is lots more upside potential here, as gold is still heavily oversold on its MACD and way below its 200-day moving average.
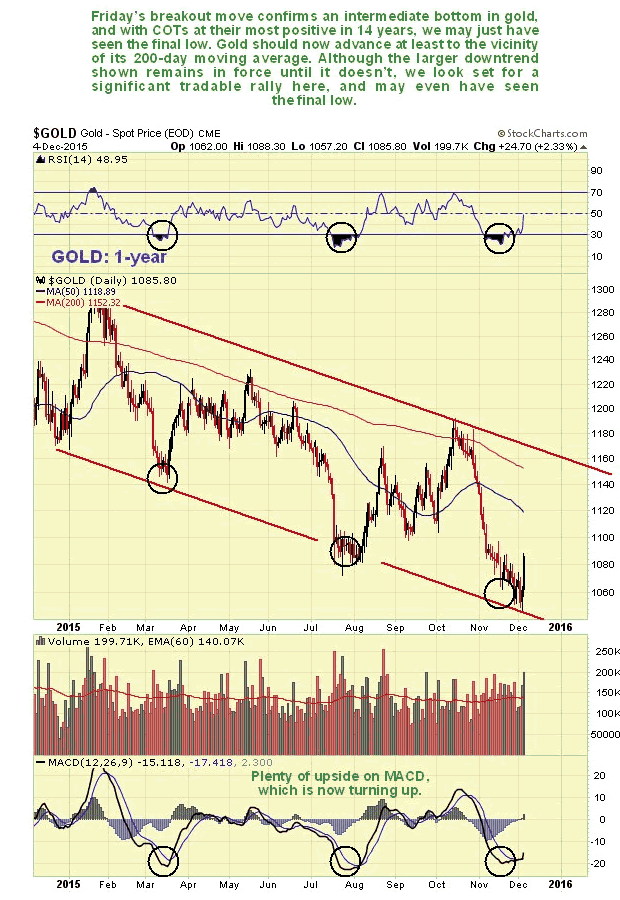
Moving on to the 1-year chart, we can see why gold is turning up now, as it is at a classic cyclical low near to the bottom of the large downtrend channel shown. While it remains a fact that it is still in a downtrend, and its moving averages are still in bearish alignment, the super bullish COTs indicate that the least we can expect to see is a rally to the upper boundary of the downtrend channel, with the most being a breakout from the downtrend to kick off a major bullmarket phase.
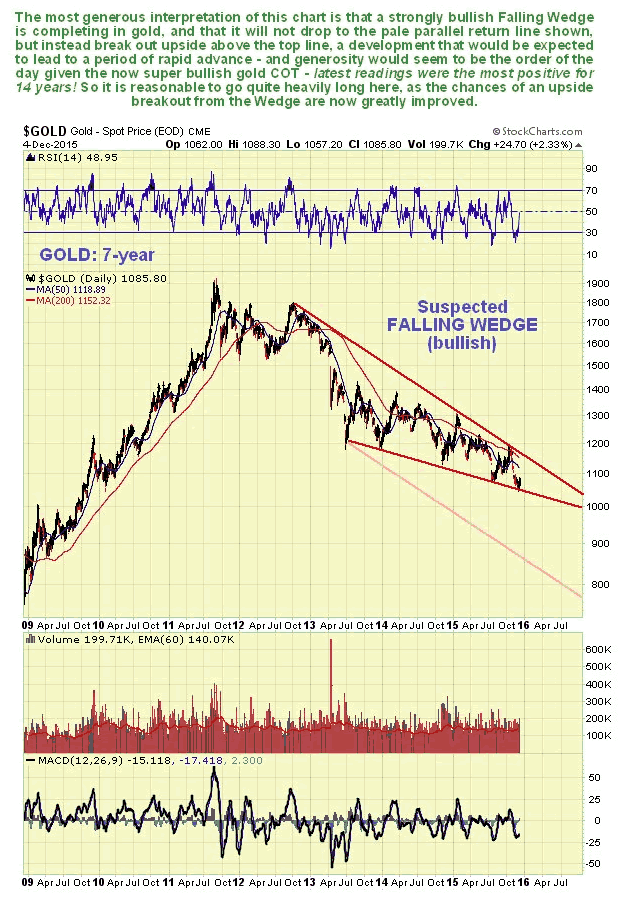
Bearing in mind the super bullish COT, which we will come to shortly, it is very interesting to observe on the 7-year chart that a strongly converging and correspondingly bullish Falling Wedge may be completing in gold. If this is so, then an upside breakout from this prospective Wedge should occur soon, and if that happens gold is likely to enter a phase of rapid advance. The intensifying disparity between the amount of physical gold supply available and the avalanche of naked shorting of paper gold that has been used to suppress the price until now has created the conditions where an upside breakout from this Wedge could drive a massive spike. The pale red parallel channel line below caters to a worst case scenario that we were earlier wary of, but this has been rendered obsolete by the latest super bullish COTs. There is always the chance that the COT structure will rapidly deteriorate as the price of gold approaches the upper channel boundary, presaging a reversal to the downside again, but this is considered unlikely, and we will cross that bridge when we come to it.
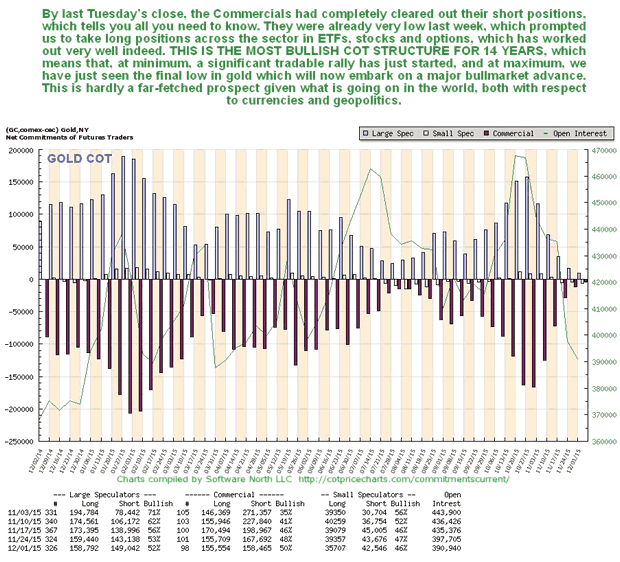
Now to the latest COT, which as you can see makes plain why gold suddenly came bursting through the gate on Friday. The Commercials have now unloaded almost all of their shorts, and have not had such a low short position in gold (virtually non-existent) since late 2001. This tells you all you need to know - which is that we can expect a thumping great rally, even if the bearmarket up to now re-asserts itself later, which it may not - this COT is so bullish it may signal that gold's final low is in and it goes up from here. This should not really come as a surprise considering that we are headed in the direction of a major currency crisis, economic collapse and war, which not even the likes of Apple, Facebook and Netflix will have the power to deflect.
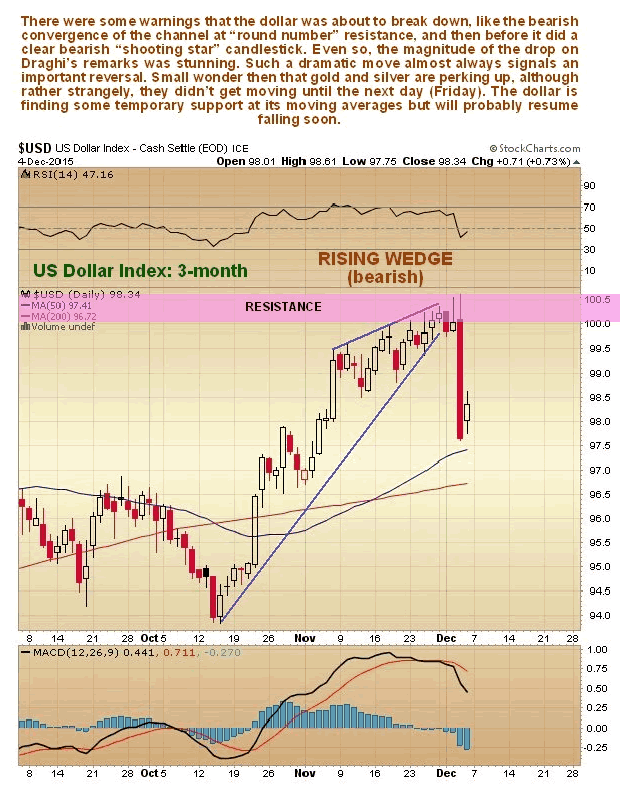
On we go to consider the startling reversal in the dollar on Thursday on its 3-month chart, which precipitated gold's breakout on Friday. Even though we knew it was likely from gold's COTs a week ago and from the Rising Wedge forming on the dollar chart, it was still of shocking magnitude, with the dollar index dropping by 2.3% in just one day, a massive move for a major currency. Ostensibly it was caused by the market's reaction to remarks by Draghi, the head of the ECB, but gold's COTs a week ago showed that this move was already "baked in" and Draghi was simply the catalyst or excuse. The point is that a move of this magnitude following a lengthy period of advance almost always signifies a major reversal. This drop may mark the beginning of the end for the dollar.
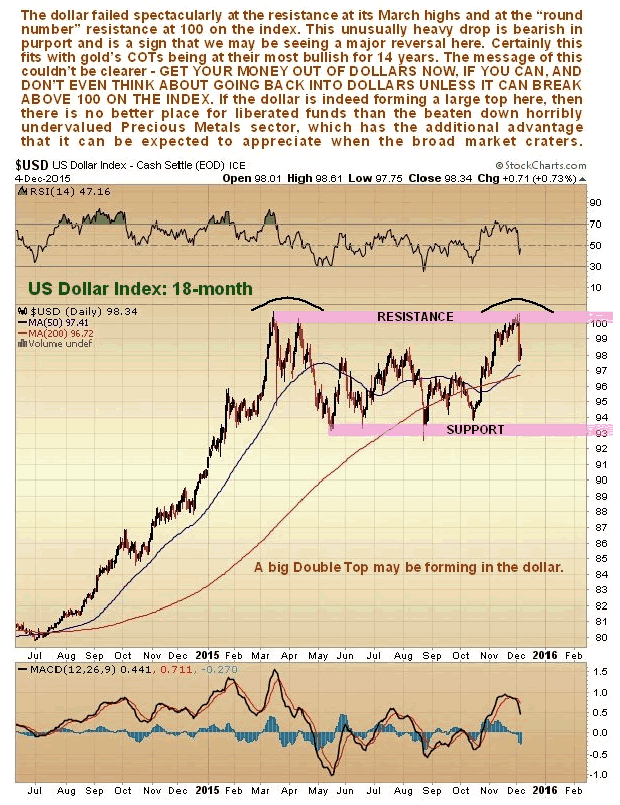
The importance of this dramatic turnaround in the dollar is further emphasized by where it occurred, which as we can see on the 18-month chart for the dollar index, was right at resistance at the March highs and at "round number" resistance at 100. What might be happening is that the dollar is building out a Double Top. Certainly it would seem to be wise to get out of dollar investments here and only consider getting back in if the dollar index can succeed in breaking above 100.
Conclusion: gold broke out convincingly on Friday to start an intermediate uptrend that will result in worthwhile gains from here for a wide range of investments across the sector. While the bearmarket may reassert itself later, latest gold COTs are so bullish that we may have seen the final low - it may be over. We will know if it succeeds in breaking out of the Falling Wedge shown on the 7-year chart.
By Clive Maund
CliveMaund.com
For billing & subscription questions: subscriptions@clivemaund.com
© 2015 Clive Maund - The above represents the opinion and analysis of Mr. Maund, based on data available to him, at the time of writing. Mr. Maunds opinions are his own, and are not a recommendation or an offer to buy or sell securities. No responsibility can be accepted for losses that may result as a consequence of trading on the basis of this analysis.
Mr. Maund is an independent analyst who receives no compensation of any kind from any groups, individuals or corporations mentioned in his reports. As trading and investing in any financial markets may involve serious risk of loss, Mr. Maund recommends that you consult with a qualified investment advisor, one licensed by appropriate regulatory agencies in your legal jurisdiction and do your own due diligence and research when making any kind of a transaction with financial ramifications.
Clive Maund Archive |
© 2005-2022 http://www.MarketOracle.co.uk - The Market Oracle is a FREE Daily Financial Markets Analysis & Forecasting online publication.