Financial Markets and the Cycle of Debt Release
Stock-Markets / Financial Markets 2015 Dec 05, 2015 - 10:49 AM GMTBy: Clif_Droke
 To many investors cycles are the holy grail of the financial market. Many investors have devoted years to the study of them. Some have even claimed to have found the ideal cycles for consistently predicting price movements. What no one can seem to agree upon is exactly which cycles are most accurate for anticipating market moves. But what all studies of the cycles share in common is an unshakable conviction that cycles hold the answers for what is coming in the future.
If there’s one thing I’ve learned over two decades of studying cycles it’s that there is no holy grail when it comes to historical market rhythms. Even if there is a “one-size-fits-all” cycle the true believers in cycles tend to forget that in the short term, factors such as trader psychology and news reactions can exert an outsized influence on markets and can temporarily whipsaw a cycle. The influence of central bank intervention and government policy initiatives can also override, or at least mitigate, the influence of cycles for prolonged periods.
As with any technical discipline, however, there’s always the temptation to strictly adhere to the cycles in a rigid manner. Alas, this is where many students of the cycles go astray. By fixing one’s focus on the cycles to the exclusion of other forms of market analysis and liquidity studies, cycle traders are often disappointed when their cycles fail to produce an expected turning point in the market. This failure can be explained by the influence of, for instance, Fed intervention which can produce cycle “inversions” or else reduce the impact of the cycle altogether. Extremes in investor sentiment can also produce temporary countercyclical shocks to the market which frustrate the cycle trader.
A general rule when it comes to cycles is that the longer the period (i.e. time), the more reliable they tend to be. Probably the most famous of these long-term cycles is the Kondratieff Wave, which tends to average 60 years in length. The K-Wave as it’s called is the dominant cycle of inflation and deflation in the economy. While it does influence stock prices, its major impact is on commodity prices which in turn influence the overall state of the economy.
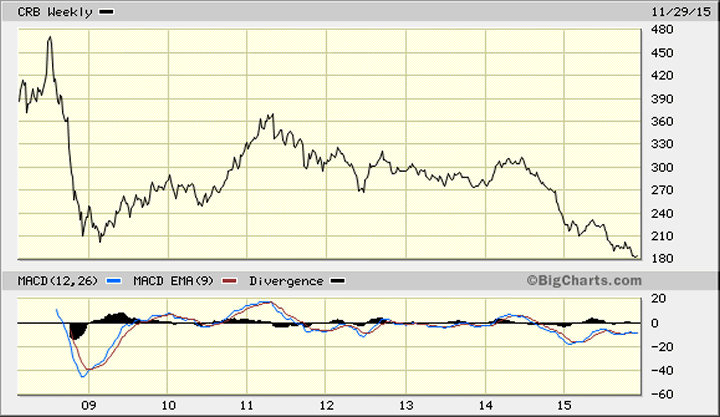
The 60-year cycle was to have bottomed around the year 2014, although the residual effects of a cycle this long can last beyond that time. This is the most likely explanation for the continued deflationary undercurrent in the global economy. Its effects are being felt most acutely in China and to some extent in Europe. A visual aid which shows the effects of this cycle-driven deflationary trend is the Reuters/Jefferies Commodity Research Bureau Index (CRB), below. As you can see, commodity prices have fallen to multi-year lows in the face of a drop in global industrial demand. The effects of the 60-year cycle are clearly manifest in this chart.

Another longer-term cycle which tends to reliably repeat is the 20-year crisis cycle, otherwise known as the “Sheep Shearing Cycle.” This rhythm manifests itself in the market plunges at roughly 20 year intervals. (It’s not to be confused with the 20-year Kress cycle.)
The crashes of 2007-08 and 1987 are examples of this rhythm, as are the 1929 crash and the 1907 panic. Major crashes tend to occur at roughly 20 year intervals, especially if there is widespread market participation among the public. The explanation for this cycle is that a generation runs approximately 20 years and it takes about that long for the old generation to forget the pain associated with the previous crash. By that time, of course, a new generation will have come along which doesn’t remember the last crash or depression and are therefore more risk averse. Thus the entire cycle of boom and bust repeats itself as the next generation repeats the mistakes of its elders.
Another reliable rhythm which manifests in both the financial market and the economy is the 7-year cycle known as the “Year of Release.” This cycle was first ordained in the Old Testament book of Deuteronomy as a relief for indebted Israelites. The law reads: “At the end of every seven years thou shalt make a release. And this is the manner of the release: Every creditor that lendeth ought [anything] until his neighbor shall release it; he shall not exact it of his neighbor, or of his brother; because it is called the Lord’s release.” [Deut. 15:1-2]
Although the year of release is no longer formally observed, this ancient precept is unconsciously embedded in the financial dealings of Western nations. The debt release cycle can be seen in the recurring price “corrections” of commodity prices, and to a lesser extent equities, at roughly seven-year intervals. This cycle can be seen manifesting in the credit crash of 2008, the tech wreck of the 2000-01, the mini-bear market of 1994, the stock market crash of 1987, the inflationary/commodity peak of 1980, and the broad market plunge of 1973-74.
The most recent 7-year debt release cycle was scheduled to make its appearance around 2015; and indeed the cycle’s effects are still being felt. Depending on how many price imbalances there are within the broader economy, the influence of the 7-year cycle can spill over into the following year, as was the case in 1973-74 and 2000-01. The primary course of the latest 7-year debt release cycle is in the commodities market, with repercussions in the overall state of the global economy. It would not be surprising if the residual impact of this cycle is felt in 2016.
The purpose of the 7-year release cycle is to wash away the negative effects of debt and other forms of financial enslavement from the economy. This would also include artificially high prices, which was clearly a problem in recent years in the energy market. That oil and gasoline prices have come down so sharply in the last year is indeed a godsend for consumers. It’s also beginning to have the beneficial effect of increasing oil demand.
One area in desperate need of correction is retail food prices. Prices to U.S. consumers at grocery outlets are, in some food categories, at or near all-time highs despite falling diesel and agricultural commodity futures prices. Before the course of the debt release cycle has completely run its course, it’s necessary that the financially enslaved among us experience a release from the heavy burden of high prices in this area.
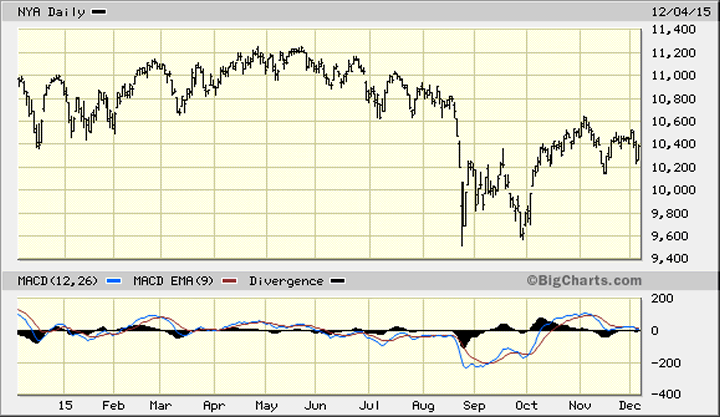
A final point to be addressed is the impact of the 7-year debt release cycle on stock prices. Since the 7-year debt cycle isn’t expressly aimed at equities, its impact on this area isn’t always sharply delineated. The main effect of this cycle is on commodities, as previously mentioned. It can be argued, though, that the 7-year cycle’s impact was felt in the stock market this year in the lagging nature of the NYSE Composite Index (NYA), which is arguably the best representation of the broad U.S. stock market. The cycle’s effect is also reflected in the abnormally large number of new NYSE 52-week lows since earlier this year.

Much of this broad market weakness is attributable to the weakness of commodity prices, especially in the energy and mining sectors. Of course it can be argued that this is a spillover effect of the longer-term deflationary cycle previously mentioned. In any event, the impacts of this cycle are still discernible in the internal condition of the NYSE broad market: new 52-week lows remain abnormally high as of this writing.
In previous commentaries I’ve suggested that next year would likely witness a bottom in the commodity prices that have lately plagued the global economy. The standard deviation of the 60-year cycle as well as the 7-year debt release cycle support this notion. By the time both cycles have completely run their course, the oppressiveness of high prices in the economy should attenuate enough to provide some relief for the debtors who need it most. Thus the Year of Release will have once again worked its magic.
Mastering Moving Averages
The moving average is one of the most versatile of all trading tools and should be a part of every investor's arsenal. Far more than a simple trend line, it's also a dynamic momentum indicator as well as a means of identifying support and resistance across variable time frames. It can also be used in place of an overbought/oversold oscillator when used in relationship to the price of the stock or ETF you're trading in.
In my latest book, Mastering Moving Averages, I remove the mystique behind stock and ETF trading and reveal a simple and reliable system that allows retail traders to profit from both up and down moves in the market. The trading techniques discussed in the book have been carefully calibrated to match today's fast-moving and sometimes volatile market environment. If you're interested in moving average trading techniques, you'll want to read this book.
Order today and receive an autographed copy along with a copy of the book, The Best Strategies for Momentum Traders. Your order also includes a FREE 1-month trial subscription to the Momentum Strategies Report newsletter: http://www.clifdroke.com/books/masteringma.html
By Clif Droke
www.clifdroke.com
Clif Droke is the editor of the daily Gold & Silver Stock Report. Published daily since 2002, the report provides forecasts and analysis of the leading gold, silver, uranium and energy stocks from a short-term technical standpoint. He is also the author of numerous books, including 'How to Read Chart Patterns for Greater Profits.' For more information visit www.clifdroke.com
Clif Droke Archive |
© 2005-2022 http://www.MarketOracle.co.uk - The Market Oracle is a FREE Daily Financial Markets Analysis & Forecasting online publication.


