Mortgage Equity Withdrawals Slump- Another Blow to Household Cash Flow
Economics / Credit Crisis 2008 Jun 24, 2008 - 05:11 AM GMTBy: Paul_L_Kasriel

 As my regular readers know - well, it is difficult to have "regular" readers if I don't write regularly anymore - I make a distinction between the wealth effect and the cash-in-hand effect. If the values of your stock portfolio or your house go up, you are wealthier "on paper," but you do not have any extra cash to spend. But if the value of your house goes up and you increase your borrowing against your housing collateral, then you have more cash in hand to spend.
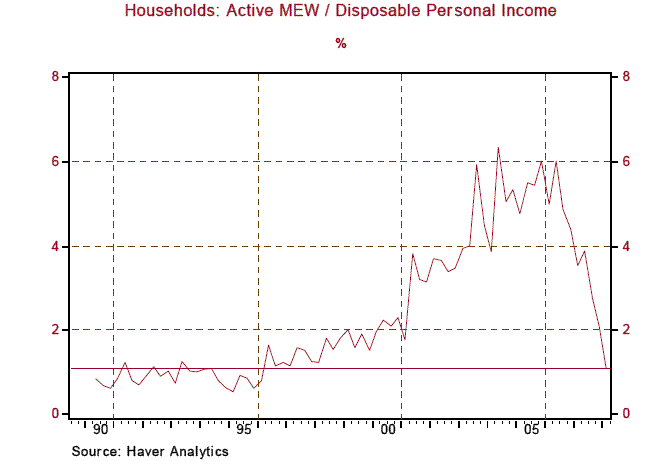
Similarly, if a corporation buys back its stock from you, you have more cash in hand to spend. In the first quarter, households' active mortgage equity withdrawal (MEW) in relation to personal disposable income fell to 1.1% -- the lowest since the first quarter of 1996 (see Chart 1). (Active MEW can be defined as mortgage equity withdrawal consisting of refinancing and home equity borrowing in contrast to inactive MEW, which consists of turnover.) Active MEW at 1.1% of disposable personal income is a far cry from the 6% it was in the heady days of 2005 and 2006.
Chart 1
But yet another blow to household cash flow in the first quarter was the sharp reduction in the "retirement" of corporate equities. After retiring a record $840 billion at an annual rate in the fourth quarter of last year, corporations retired only $75 billion of shares in the first quarter of this year (see Chart 2). Now, if corporations are retiring equities, by definition, some entity must be selling shares back to the corporations. In recent quarters, the biggest net seller of corporate equities has been U.S. households.
In relation to disposable personal income, households net sales of corporate equities went from a record high 10.3% in the fourth quarter of last year down to only 1.5% in the first quarter of this year (see Chart 3). So, not only was first-quarter household cash flow constrained by much lower MEW, it also was constrained by much lower share buybacks by corporations.
Chart 2
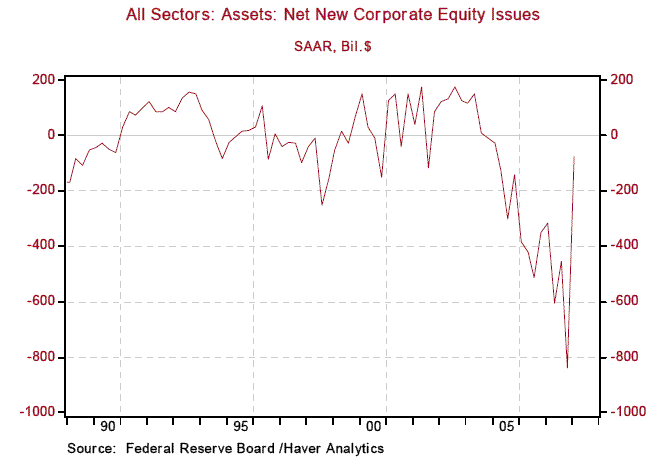
Chart 3
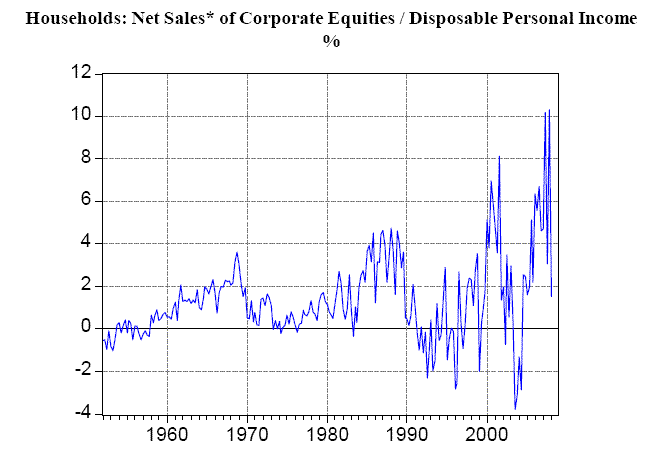
* Direct net sales by households plus net sales by mutual funds,
broker/dealers and ETS.
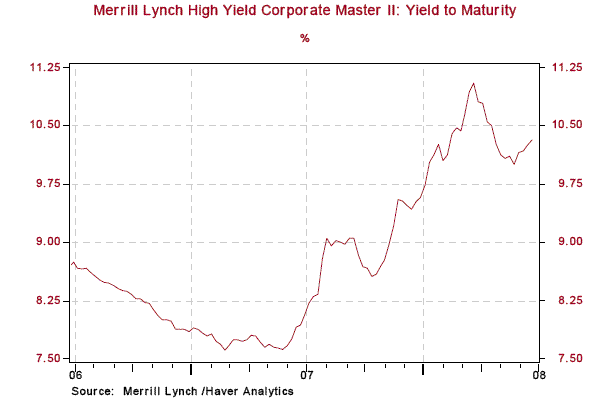
It almost is a given that MEW will continue to fall as house prices, and, thus, home equity continue to fall. But what about corporate buybacks? They are unlikely to surge again soon for two reasons. Firstly, corporate profit growth, a source of funding for share buybacks, will remain puny throughout 2008, save for energy company profits. Secondly, in recent quarters, as profit growth slowed, nonfinancial corporations picked up their borrowing, in excess of their capital spending, presumably to fund share buybacks (see Chart 4). But with borrowing costs up for the less credit-worthy corporations (see Chart 5) and with financial institutions tightening their lending terms, borrowing to fund share buybacks is likely to be less feasible. In short, retailers had better not count on strong sales once those tax rebate checks have been spent because household cash flow is diminishing at a rapid rate.
Chart 4
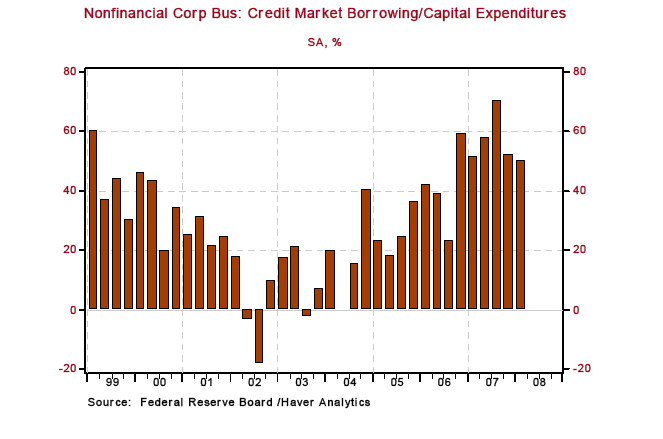
Chart 5
By Paul L. Kasriel
The Northern Trust Company
Economic Research Department - Daily Global Commentary
Copyright © 2007 Paul Kasriel
Paul joined the economic research unit of The Northern Trust Company in 1986 as Vice President and Economist, being named Senior Vice President and Director of Economic Research in 2000. His economic and interest rate forecasts are used both internally and by clients. The accuracy of the Economic Research Department's forecasts has consistently been highly-ranked in the Blue Chip survey of about 50 forecasters over the years. To that point, Paul received the prestigious 2006 Lawrence R. Klein Award for having the most accurate economic forecast among the Blue Chip survey participants for the years 2002 through 2005.
The opinions expressed herein are those of the author and do not necessarily represent the views of The Northern Trust Company. The Northern Trust Company does not warrant the accuracy or completeness of information contained herein, such information is subject to change and is not intended to influence your investment decisions.
Paul L. Kasriel Archive |
© 2005-2022 http://www.MarketOracle.co.uk - The Market Oracle is a FREE Daily Financial Markets Analysis & Forecasting online publication.


