


Gold & Silver Correlations for August 2015
Commodities / Gold and Silver 2015 Aug 13, 2015 - 12:36 PM GMTBy: Mike_McAra

 Correlation seems almost like a magical word. In fact, most people don’t have to use this term more often than a couple of times a year. In the world of investing, however, correlation is an important concept which has to do with how different assets move in relation to one another. Before we even dive into what correlation means in the world of statistics, we’ll focus on the intuition behind it.
Investing in gold and silver, mining stocks or other precious metals usually has the goal of earning a positive return. This is usually done by taking a position in an asset. For instance, an investor buys gold in hope of the appreciation of the yellow metal. If the price of gold goes up, there is a gain. If it goes down, there is a loss. All this is very simple but the purpose of this example is to show that the price fluctuations are very important to precious metals investors and traders.
The price of gold is one of the most important figures precious metals investors look at. But gold is not the only asset in the precious metals market. Silver and mining stocks are also very important. How do they relate to one another? Do gold and silver move in the same direction? Is the relationship stable? Maybe the relationship is different for different time horizons?
There’s more. The exchange rate of the U.S. dollar is one of the most important economic indicators for the U.S.-based precious metals investors. The largest mining stocks are quoted on stock exchanges. Is there a relationship between the miners and general stock market indices such as the Standard and Poor’s 500 (S&P 500)?
Now, the relationships we’re writing about can be either positive or negative. Positive in the sense that an increase in one indicator coincides with an increase in another. For instance, an increase in the price of gold might coincide with an increase in the price of silver. It can also be negative. For instance, an increase in the exchange rate of the U.S. dollar might coincide with a decrease in the price of gold priced in the dollar.
How to measure the sort of relationships we’re writing about? Correlation provides a way to quantify this. It puts a number on the relationship. This number ranges from -1 to 1 where the most negative number (-1) corresponds to a perfectly negative relationship (when one quantity goes up, the other goes down), while the most positive number (1) corresponds to a perfectly positive relationship (when one quantity goes up, the other goes up as well).
Of course, the real world is not perfect, meaning that the correlation almost never is exactly -1 or 1. Instead, it is usually a number somewhere in between. The closer the number to -1, the stronger and more negative the relationship used to be in the past. The closer the number to 1, the stronger and positive the relationship used to be in the past. There is also a third “special” number here, namely 0, the midpoint of the range. The closer the correlation is to 0, the weaker any kind of past relationship is. When the number is close to 0, we might say that there has been no correlation between the two quantities.
How might this be of use to precious metals investors? Let’s take a look at the correlations in the first week of August 2015 to see what they might tell us. We will do this by looking at the Correlation Matrix – our tool which calculates the correlations in the precious metals market and presents them in an easy-to-digest form.
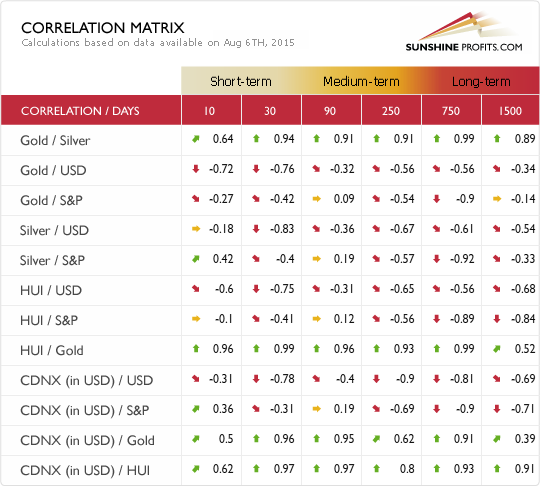
A couple of words of introduction to the tool are in order here. The column on the left-hand side shows you the pairs of assets that the correlations have been calculated for. For instance, in the first row below the header of the table, we have “Gold / Silver.” This means that this row shows the correlations calculated between gold and silver. The second row is labeled “Gold / USD.” This denotes the correlation between gold and the U.S. dollar. As such, the second row displays correlations between gold and the greenback.
Now, you have probably noticed that each row displays various correlations, not just one number. The different numbers show you the correlation over a given number of days, from 10 to 1500 (10 and 30 are marked as short-term, 90 and 250 as medium-term, 750 and 1500 as long-term). These different numbers of days are organized in columns (10, 30, 90 and so on). Putting the rows together with the columns gives you specific correlations. For example, the number in the “Gold / Silver” row, in the 1500 column is 0.89. This means that the correlation between gold and silver over the last 1500 days was 0.89. If you look at the “Gold / S&P” row and the 10 column, you see -0.27. This means that the correlation between gold and the S&P 500 index over the past 10 days stood at -0.27.
To make things easier for you, we have marked the correlations with arrows – green, red and yellow. Green arrows show you potentially strong positive correlation, red ones potentially strong negative correlation while yellow indicate that the correlation might be moderate (in either direction). The easiest way to read this is that a green arrow shows you that the two assets (indices) tended to move in the same direction, a red that the assets tended to move in opposite directions while a yellow one that the assets tended to fluctuate rather independently.
Now, let’s move to specific numbers from the table. It is commonly believed among precious metals investors that gold and silver tend to move together. With the Correlation Matrix we can verify this claim. In the “Gold / Silver” row and the 1500 column, we see 0.89 and a green arrow. This means that gold and silver in fact tended to move together over the last 1500 days (which is approximately 6 years). So, in the long term, the yellow metal tended to move together with the white metal.
The long term, however, is not all that interests us. So, let’s look at shorter time horizons. We see that the correlation between gold and silver is above 0.9 for all the horizons between 30 and 750 days. This means that in the time horizons of a month to six years (more or less) gold and silver tended to move in the same direction and strongly so. Where things get interesting is the shortest time horizon, 10 days. The correlation here is 0.64. This means that in the last 10 days gold and silver still moved in the same direction but not as strongly as in, say, the last month or the last couple of years. The implication is that the relationship in the last couple of days might have been weaker than it tended to be over the short term. This is still not very significant divergence for now but it might be in the future. Just imagine the correlation between gold and silver dropping to 0 over for the 10 day time span. This would be an important indication that the relationship between gold and silver is not as it tended to be, and so a measure worth observing.
One way to use this is to consider the short-term correlation in light of the long-term one. For instance, in the “Gold / USD” row we see the long-term correlation between gold and the U.S. dollar at -0.34 (1500 days). This means that over the long term gold and the dollar tended to move in opposite directions but definitely not perfectly so. A short glance at the short-term columns (10 days & 30 days) shows the correlations at -0.72 & -0.76. This suggests that in the recent days gold has tended to move in the opposite direction than the dollar and stronger than over longer past horizons. So, the relationship between gold and the dollar might have been stronger recently than it was on average over the last couple of years.
This might be read in two ways. Firstly, it might mean that given the more negative than usually correlation, gold might move up more in a lockstep with gold than it generally used to in the past. A move down in the dollar could be accompanied by a relatively stable move up in gold. Secondly, we might see the correlation as reverting to its long-term value. This implies that the temporarily stronger correlation between gold and the dollar might go back to weaker, less negative levels. This suggests that the short-term correlation should not be relied upon for long-term bets and it shouldn’t be the only indicator you take into account making your trading decisions.
Our last example will focus on silver and the U.S. dollar (“Silver / USD” row). It shows how you can combine the info on correlation with charts, for example to call a local bottom. The long-term correlation (1500 days) between silver and the U.S. dollar used to be negative at -0.54. The shorter-term correlation for the 30 day window is even more negative at -0.83. But the 10 day correlation is much weaker and not that negative at all (0.18). What might this mean? That silver has very recently stopped moving together with the U.S. dollar. Let’s take a look at the U.S. Dollar Index chart (charts courtesy by http://stockcharts.com).
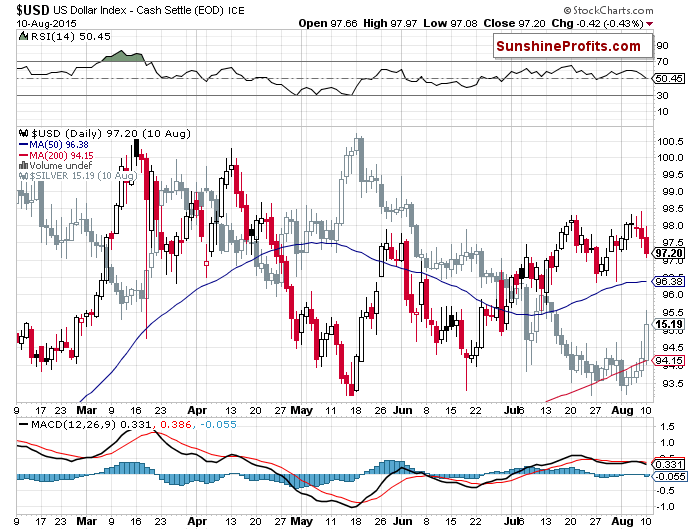
We see that up to Aug. 6, 2015, the move up in the dollar was up. At the same time, silver didn’t exactly move in the opposite direction as shown by the 0.18 short-term correlation. This might have suggested that silver was now not moving typically with respect to the dollar. In typical times a move up in the dollar might be accompanied by a move down in silver, albeit not a perfect one (long-term correlation at -0.54). The weak short-term correlation at 0.18 might have suggested that silver was trading in a different way than it usually does. In this specific case, this could mean the refusal to decline when the dollar appreciates. This, in turn, could have pointed to strength in silver and a possible move up in the future. The move up is already transpiring but it might continue even further. In this way, using the Correlation Matrix together with charts might give you additional insight into the precious metals market.
Regards,
Mike McAra
Bitcoin Trading Strategist
Bitcoin Trading Alerts at SunshineProfits.com
Disclaimer
All essays, research and information found above represent analyses and opinions of Mike McAra and Sunshine Profits' associates only. As such, it may prove wrong and be a subject to change without notice. Opinions and analyses were based on data available to authors of respective essays at the time of writing. Although the information provided above is based on careful research and sources that are believed to be accurate, Mike McAra and his associates do not guarantee the accuracy or thoroughness of the data or information reported. The opinions published above are neither an offer nor a recommendation to purchase or sell any securities. Mr. McAra is not a Registered Securities Advisor. By reading Mike McAra’s reports you fully agree that he will not be held responsible or liable for any decisions you make regarding any information provided in these reports. Investing, trading and speculation in any financial markets may involve high risk of loss. Mike McAra, Sunshine Profits' employees and affiliates as well as members of their families may have a short or long position in any securities, including those mentioned in any of the reports or essays, and may make additional purchases and/or sales of those securities without notice.
© 2005-2022 http://www.MarketOracle.co.uk - The Market Oracle is a FREE Daily Financial Markets Analysis & Forecasting online publication.