Gold And Silver Charts Are The Compelling Story. Fundamentals Do Not Apply
Commodities / Gold and Silver 2015 Aug 02, 2015 - 05:03 PM GMTBy: Michael_Noonan
 Not in 2013, not in 2014, and so far, nothing positive for the price of gold and silver has developed in what looks like for the balance of 2015. Most of the highly regarded gold and silver sites and bloggers have been expecting an upside breakout, some even saying an explosive breakout. As we have been saying for the past few years, the "eyes" have it. Just by following developing price activity, in chart form, it is more than obvious that price continues to languish at recent 4 -5 year lows with NO signs of ending.
It does not matter how much gold China has bought, how many gold/silver coins have been sold to the public, even record numbers. It does not matter how low is the existing supply for silver and its excessive and growing demand. So far, it has not mattered how the miners have been suffering and are closing down operations.
What does matter is the proverbial 800 pound gorilla in the room, the globalists, elites, central bankers. They are so controlling that the natural laws of Supply and Demand have been subverted, temporarily corrupted that speaks to the entirely subversive and corrupt nature of the globalists, those who are the controllers behind a New World Order, pretty much in place with little to no opposition.
Those who have been "long and wrong" the physical from much higher prices have not been "wrong." The reasons for buying and physically holding the physical metal have not altered one iota, and, in fact, what we just said is the good news. Let us remind again how the laws of action and reaction, while temporarily suspended, albeit in a prolonged time frame, the opposite reaction will come into play. The not so bad news is no one knows when it will come into play.
The number of mostly negative events dominating the Western world hve been accelerating at an alarming pace, one right after the other, none of which make any economic sense, save for the globalist's news media ever putting a positive spin on the negative, feeding lie after lie after lie. Sadly, too many have come to always believe in the lies because they come from the "government," a [mis]trusted source.
As Obama and the equally corrupt supreme court have made clear, political lying is truly a protected form of speech. As a consequence, the only statements made by politicians are lies. Believe them at your own peril, and whenever politicians are in control, you can believe your economic life is in peril.
It becomes clearer that the globalists have just about finished draining all of the wealth from Western governments, the US being the biggest [stolen] jewel in their crown, and are in the end game but not quite finished. All of the hidden, least understood derivatives have to be unwound. Once that is accomplished, and Western people have been stripped of what little wealth and freedom they have left [Greece, coming soon to your neighborhood], the switch to the East will begin in more earnest.
It is worth mentioning that maintaining control over a blatantly broken financial system can explode the the elites lying faces at any time. That is a lower probability, but one that grows with each passing month.
For the past few decades, the globalists have been preparing to take over the Eastern world and plunder Eastern wealth over the next 100 years. China, Putin/Russia, BRICS, AIIB, NDB, et al, are not going to defeat the West. Quite the contrary, the parasitic globalists have already defeated the West, sucked it dry of its wealth and gained total control over every aspect of people's lives. China, Putin/Russia, BRICS, AIIB, NDB, et al, are next up on their agenda, so do not expect the Eastern "good guys" to put the Western "bad guys" in their place. The globalists are pulling the same strings in both arenas. Do not doubt that for a minute.
It is harder to make the story for an Eastern takeover by the globalists, at this point, but when it was happening to the US, well over 150 years ago, it was hard to make that story then. It was beyond sane comprehension, but all the signs were there. Many still do not believe or accept an elite global takeover of the Western world, so it would be an even harder story to "sell," at this stage.
The manipulated suppression of gold and silver is the most revealing final stage of how the central bankers have been in total control for the past century, not just the past decade or two or three. There is no other power on earth that can account for the corruption and suspension of supply and demand for PMs, and that should be your clue as to how vast and deeply penetrating the elites are able so exert such influence, unopposed.
Once they are able to more viably make the transition from West to East, then the price of gold and silver will move to the upside. Will it be as explosive as so many, including us a few times, have conjectured? Maybe, maybe not. China is looming largest in this global transition of shifting powers and economic control. That country has a decidedly different approach in both method and timing as to how she wants to see the new Eastern world develop. A rise in the price of gold to $10,000, or some multiple, may not be how China wants the price of gold to be valued. That country takes a more deliberate and controlling stance on everything.
From all indications, China is willing to be a part of the existing globalists' fiat money power control structure, via the IMF. While the New Development Bank [NDB] is supposed to be a replacement or competitor to the IMF, and the Asian Infrastructure Investment Bank [AIIB], a total turn away from the US fiat petrodollar, all that is going on behind the scenes may not be known for many years to come, so everything is speculative.
What is the least speculative are the charts for gold and silver. All of the fundamentals for PMs simple do not apply, at present, and all of the stories coming out of the gold/silver community are based more on sentiment and belief in the fundamentals while ignoring the reality of price, which is telling a completely different story.
Hold whatever physical gold and silver you have, and make sure you physically have it.
If you do not have it, more than likely, you will never own it. That is how events have been proving out. Do not hesitate to continue to buy and hold more, regardless of price and even if price is to go lower. Access to buying physical PMs may dry up. Governments will surely make it much harder to buy, as controls can easily come into play.
Gold and silver have been one of the most reliable and proven forms of wealth preservation. The globalists want people to become disheartened in owing silver and gold. Yet, gold is the most coveted form of wealth by the globalists since the days when the Rothschilds took control of Western world finances and governments, along with every thing else.
The charts continue to paint a different picture from what most are told in the media and different from what most in the PM community have come to expect and believe, as well.
We start with the fiat Federal Reserve Note, called the "dollar," because it is the antithsis for gold and silver.
The monthly chart shows a very bullish developing scenario, despite the call for the demise of that worthless fiat. Its "value" derives from the faulty imagination of its users, which is most of the real world. However sadly true that may be, a billion wrongs will still never make a single truth wrong. Again, this shows the power of deception and influence the globalists have maintained for the past few hundred years, for it is not a recent phenomena.
US Dollar Monthly Chart
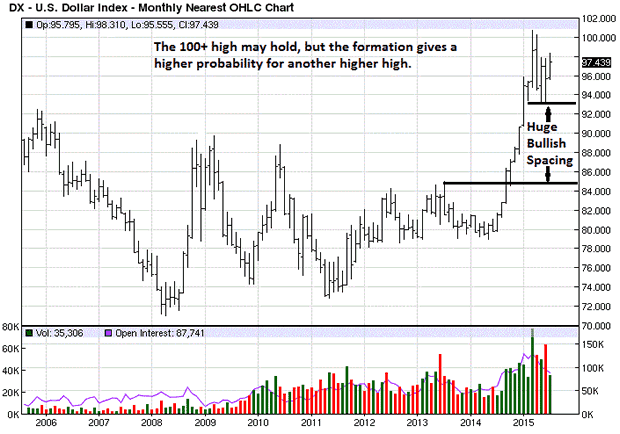
We often advise to watch how price acts/responds to obvious resistance or support.
98 has been a resistance area, yet there is no apparent selling overtaking buying at resistance. This suggests price will continue to move higher. That conclusion is also in line with knowing the most important market information, the trend. A trend will persist longer than most expect.
US Dollar Weekly Chart
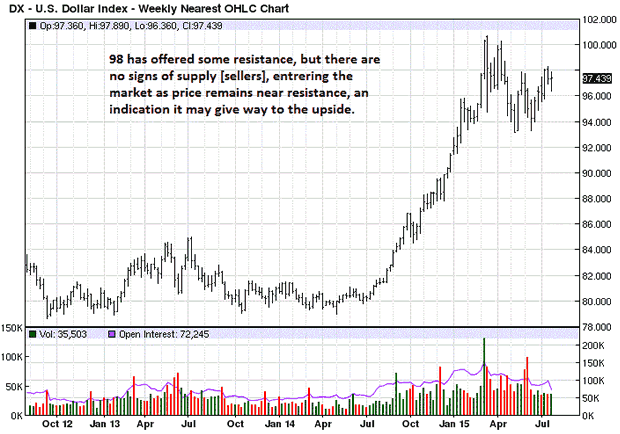
"Trust your eyes." However much gold China has been buying, however much the demand has been from countries and individuals, however much supply appears to by drying up, the power of control exercised by the elites remains unparalleled in history. Price is a function of elite control and nothing else. Believe otherwise, if you chose, but there is no arguing with what is, regardless of how much you believe it should otherwise be.
There is a small area of bullish spacing that corresponds to the touted 1035-1045 support level that appears valid. While most people look at daily and intra day charts, this time frame is more in line with what smart money watches, while ignoring daily charts.
It takes more time and effort to change a trend on the higher monthly time frame, a simple fact. Given the decline to recent lows, the probability of a slingshot turnaround to the upside is very low. It can happen, but the odds are low, and money is best made being in sync with the higher probability odds, another fact.
Gold Monthly Chart
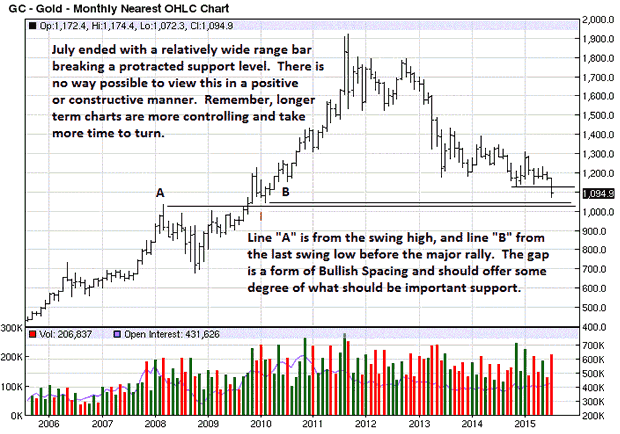
Last week's attempt to rally looks rather feeble, relative to the prior down week that broke support. If price does not continue lower, next week, even the prospects of a rally have a series of overhanging resistance areas along the way. A lot of damage has been done to this market, and it will take time and effort to repair it.
As things stand, the prospects for a turn in the gold market are small. It can change next week, but next week has not happened, so all we can do is deal with what is known and change only when what is known has changed.
Gold Weekly Chart
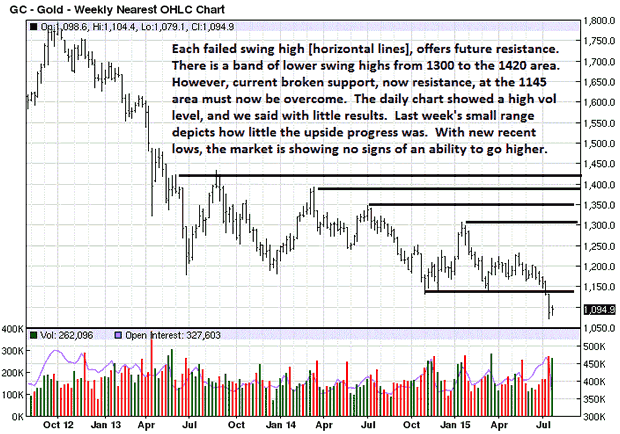
Market assessments always need to be confirmed by price activity. The higher volume days are occurring on lower closes from the prior day, but price is not making further downside progress. That would argue for a rally. At the same time, with the increased volume, price has not made any inroads to the upside and remains under a 50% retracement, typical in a down market, and that would argue to continuation lower.
Is the glass half-empty or half-full? This is where one needs to let the market develop more and confirm its next direction. An inability to rally away from 1080 support, with sustainability, suggests support will likely give way. The lower probable event is a rally, next week. Let the market confirm its intent and then react accordingly.
Gold Daily Chart
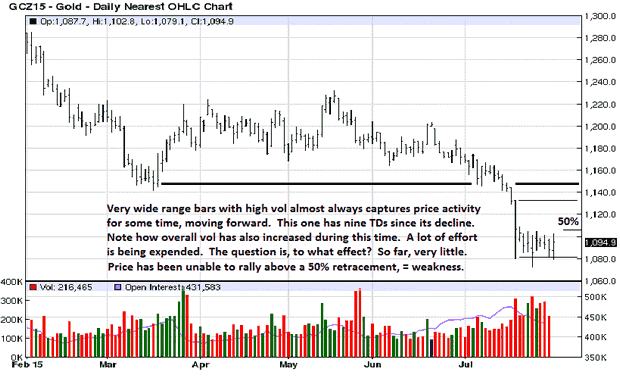
We will always maintain that charts are the very best source for the most accurate price information and intent available. That not a lot of people know how to read charts does not diminish their reliability. Of course, we are not talking about the use of mechanical aides like moving averages, RSI, MACD, Elliott Wave, etc. The combination of price and volume, sometimes with Time added, is most reliable.
The easiest read for silver and gold is to recognize their trends remain down. More money is lost trying to pick bottoms [and tops], so do not fall into that money-losing ego trap.
Silver Monthly Chart
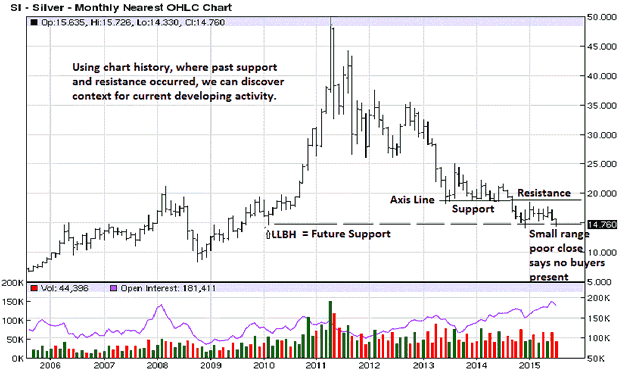
While price and volume are the most reliable indicators, it does not mean there is 100% clarity at all times, such as now. Realize that the trend has been down and developing activity has also been in sync with the down trend. There will be periods where it may be hard to read what the market is saying. This is yet another reason to let the market confirm its intent.
If one were trying to make a first time decision as of last week, having not participated in the down trend of the last several years, that would be a difficult call to make, based on the two very small range bars. Trend and probability favor the downside.
Silver Weekly Chart
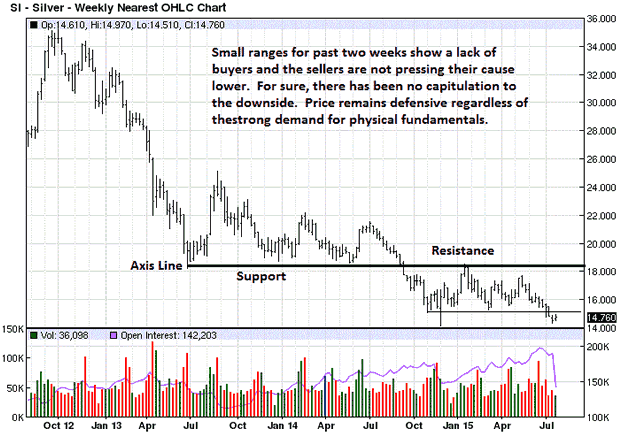
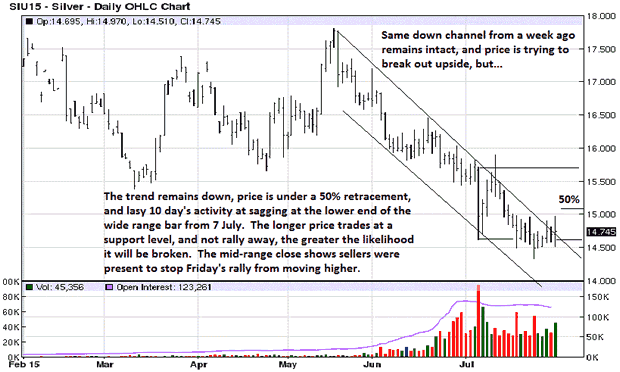
The chart comments are fairly conclusive. The trend is down, price is not exhibiting strength, so trying to buy in the paper market makes little sense. If we were to focus on the last bar on the chart, in context with what precedes that bar, the conclusion would be to expect more downside.
Why?
Volume increased [effort], the highest volume for the week. Price made a slightly higher probe above the last 10 TDs, but note where it closed: mid-range the bar. On increased volume, the mid-range close tells us sellers were aggressive and overcame the effort of buyers sufficient to push price down from the high of the day. In a down trend, the onus is on buyers to effect change. Buyers are not meeting that burden. It is tough to change a trend. Respect it, at all times, until a change has been confirmed.
Silver Daily Chart
By Michael Noonan
Michael Noonan, mn@edgetraderplus.com, is a Chicago-based trader with over 30 years in the business. His sole approach to analysis is derived from developing market pattern behavior, found in the form of Price, Volume, and Time, and it is generated from the best source possible, the market itself.
© 2015 Copyright Michael Noonan - All Rights Reserved Disclaimer: The above is a matter of opinion provided for general information purposes only and is not intended as investment advice. Information and analysis above are derived from sources and utilising methods believed to be reliable, but we cannot accept responsibility for any losses you may incur as a result of this analysis. Individuals should consult with their personal financial advisors.
Michael Noonan Archive |
© 2005-2022 http://www.MarketOracle.co.uk - The Market Oracle is a FREE Daily Financial Markets Analysis & Forecasting online publication.


