


Stock Market Oversold, Major Low Imminent
Stock-Markets / US Stock Markets Jun 21, 2008 - 05:11 PM GMTBy: Mike_Burk

 The good news is: The market is oversold and there is reason to think we are at or very near the low for this downward move.
Short Term
Every one of the issues in the Dow Jones Industrial Average (DJIA) is below its 50 day EMA, a relatively rare event that has occurred near bottoms.
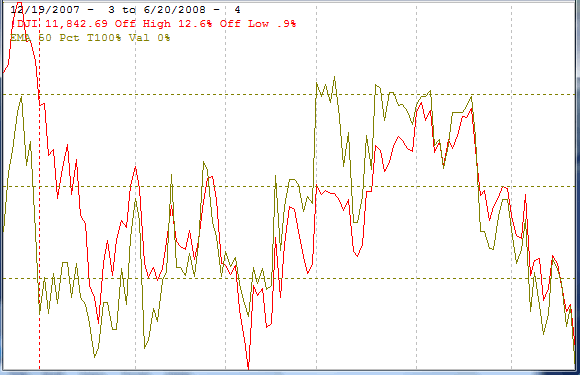
The chart below covers the past 6 months showing the DJIA in red and the percentage of the component issues of the DJIA that are above their 50 day EMA's in olive drab. Dashed vertical lines have been drawn on the 1st trading day of each month and dashed horizontal lines have been drawn at 25%, 50% and 75% values for the indicator.
The indicator hit 0 on Friday for the 1st time since February 2003.
There was a cluster of 0% readings near the 2002 bottom shown in the chart below that covers the period from April 2002 to April 2003. All of the 0% readings occurred near tradable lows.
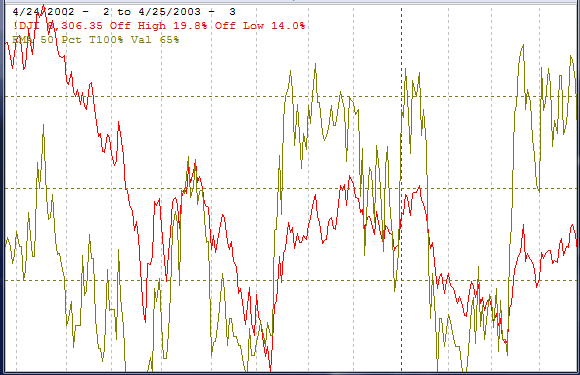
Prior to the 2002 - 2003 cluster there was one at the September 2001 low, the April 2000 low and the August 1998 low.
Currently the percentage of the component issues above their 50 day EMA's is much better for the other major indices, they are:
| DJIA | 0% |
| S&P500 (SPX) | 17.5% |
| S&P Mid cap | 32.0% |
| Russell 2000 (R2K) | 43.1% |
Intermediate Term
Near the low last August there were 1132 new lows on the NYSE, at the January low there were 1114 new lows and at the March low there were 759 new lows. At each of those points I pointed out there was a high likelihood of a retest because of the high number of new lows. On Friday the DJIA closed less than 1% above its March low (close enough to qualify as a retest) and there were "only" 275 new lows, not enough to imply a high likelyhood of another retest. The market could collapse in the next few days generating a lot of new lows, but that scenario seems unlikely.
The chart below covers the past year showing the DJIA in red and a 10% trend (19 day EMA) of NYSE new lows (NY NL) in blue. NY NL has been plotted on an inverted Y axis so decreasing new lows move the indicator upward (up is good). NY NL hit its lowest low for the period last August, came close to the previous low in January, made a much higher low in March. As of Friday's close the DJIA was less than 1% above its March low while NY NL is substantially higher than it has been at any of the previous lows.
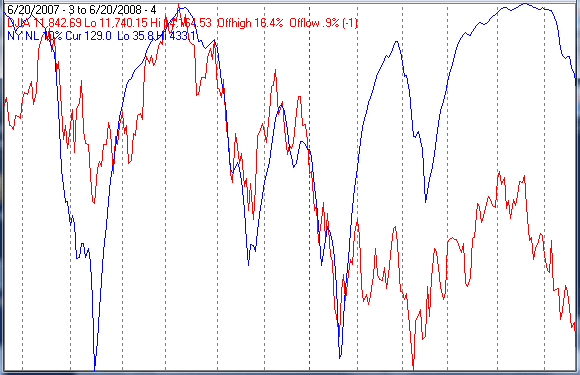
It is only the DJIA retesting its March low.
The chart below covers the period from the March low through last Friday showing the DJIA in red, the S&P 500 (SPX) in black, the NASDAQ composite (OTC) in blue and the R2K in Magenta. The DJIA is 0.9% off its March low while the SPX is 3.5% off its low, OTC and R2K are 10.9% and 12.7% off their March lows respectively.
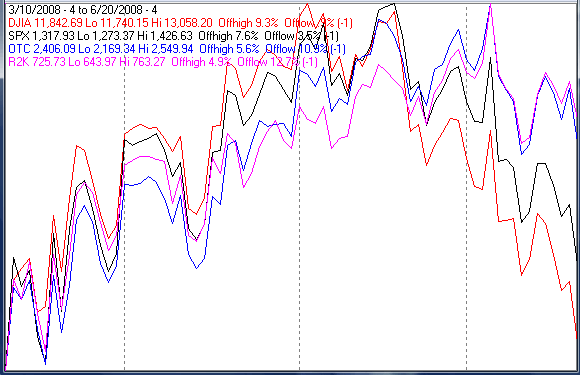
It appears we are at or very near an intermediate term low.
Seasonality
Next week includes the 5 trading days prior to the 4th Friday in June during the 4th year of the Presidential Cycle.
The tables show the daily return on a percentage basis for the 5 trading days prior to the 4th Friday in June during the 4th year of the Presidential Cycle. OTC data covers the period from 1963 - 2007 and SPX data from 1953 - 2007. There are summaries for both the 4th year of the Presidential Cycle and all years combined. Prior to 1953 the market traded 6 days a week so that data has been ignored.
Over all years, on average the coming week has yielded negative returns, however, during the 4th year of the Presidential Cycle the returns have been positive.
Report for the week before the 4th Friday of June
The number following the year is the position in the presidential cycle.
Daily returns from Monday through the 4th Friday.
| OTC Presidential Year 4 | ||||||
| Year | Mon | Tue | Wed | Thur | Fri | Totals |
| 1964-4 | 0.33% | 0.05% | -0.13% | 0.38% | 0.28% | 0.91% |
| 1968-4 | 0.19% | 0.39% | 0.00% | -0.33% | -0.22% | 0.03% |
| 1972-4 | -0.40% | 0.24% | 0.24% | -0.45% | -0.44% | -0.81% |
| 1976-4 | 0.11% | -0.68% | -0.39% | 0.68% | 0.28% | 0.01% |
| 1980-4 | 0.31% | 0.43% | 0.69% | 0.16% | 0.11% | 1.70% |
| 1984-4 | 0.50% | 0.44% | 0.20% | 0.59% | 0.57% | 2.30% |
| Avg | 0.14% | 0.16% | 0.18% | 0.13% | 0.06% | 0.65% |
| 1988-4 | -0.24% | 0.46% | 0.72% | 0.13% | 0.15% | 1.21% |
| 1992-4 | -0.81% | 0.66% | -0.36% | -0.58% | -0.07% | -1.15% |
| 1996-4 | 0.64% | -0.87% | -1.65% | 1.10% | 1.63% | 0.85% |
| 2000-4 | 3.35% | 0.59% | 1.26% | -3.13% | -2.32% | -0.26% |
| 2004-4 | 0.00% | 0.00% | 0.00% | 0.00% | 0.00% | 0.00% |
| Avg | 0.73% | 0.21% | -0.01% | -0.62% | -0.15% | 0.17% |
| OTC summary for Presidential Year 4 1964 - 2004 | ||||||
| Avg | 0.40% | 0.17% | 0.06% | -0.14% | 0.00% | 0.48% |
| Win% | 70% | 80% | 56% | 60% | 60% | 70% |
| OTC summary for all years 1963 - 2007 | ||||||
| Avg | -0.08% | 0.04% | 0.07% | -0.02% | -0.12% | -0.12% |
| Win% | 41% | 64% | 51% | 61% | 52% | 50% |
| SPX Presidential Year 4 | ||||||
| Year | Mon | Tue | Wed | Thur | Fri | Totals |
| 1956-4 | -0.43% | 0.11% | 0.41% | 0.69% | -0.30% | 0.48% |
| 1960-4 | -0.49% | -0.09% | 0.30% | 0.54% | 0.16% | 0.42% |
| 1964-4 | 0.27% | -0.42% | 0.36% | 0.19% | 0.31% | 0.70% |
| 1968-4 | -0.27% | -0.31% | 0.00% | -0.10% | -0.40% | -1.08% |
| 1972-4 | -0.23% | 0.42% | 0.21% | -0.10% | -0.38% | -0.08% |
| 1976-4 | 0.50% | -0.78% | -0.21% | 0.52% | -0.07% | -0.03% |
| 1980-4 | 0.39% | 0.55% | 1.37% | -0.45% | -0.16% | 1.70% |
| 1984-4 | 1.81% | 0.58% | 1.46% | -0.21% | -0.03% | 3.61% |
| Avg | 0.44% | 0.09% | 0.71% | -0.07% | -0.21% | 0.82% |
| 1988-4 | -0.64% | 1.02% | 1.47% | -0.30% | -0.38% | 1.16% |
| 1992-4 | -0.07% | 0.16% | -0.05% | -0.18% | 0.08% | -0.05% |
| 1996-4 | 0.30% | -0.05% | -0.61% | 0.63% | 0.31% | 0.57% |
| 2000-4 | 1.47% | -0.67% | 0.21% | -1.82% | -0.74% | -1.55% |
| 2004-4 | 0.00% | 0.00% | 0.00% | 0.00% | 0.00% | 0.00% |
| Avg | 0.26% | 0.11% | 0.25% | -0.42% | -0.18% | 0.03% |
| SPX summary for Presidential Year 4 1956 - 2004 | ||||||
| Avg | 0.22% | 0.04% | 0.45% | -0.05% | -0.13% | 0.49% |
| Win% | 50% | 50% | 73% | 42% | 33% | 58% |
| SPX summary for all years 1953 - 2007 | ||||||
| Avg | -0.17% | 0.14% | 0.04% | -0.01% | -0.14% | -0.13% |
| Win% | 38% | 56% | 53% | 54% | 44% | 56% |

Conclusion
The market appears to be putting in a bottom that should hold for quite a while.
I expect the major indices to be higher on Friday June 27 than they were on Friday June 20.
By Mike Burk
To subscribe to this report : http://alphaim.net/signup.html
Gordon Harms produces a Power Point for our local timing group. You can get a copy of that at: http://www.stockmarket-ta.com/ .
Disclaimer: Mike Burk is an employee and principal of Alpha Investment Management (Alpha) a registered investment advisor. Charts and figures presented herein are believed to be reliable but we cannot attest to their accuracy. Recent (last 10-15 yrs.) data has been supplied by CSI (csidata.com), FastTrack (fasttrack.net), Quotes Plus (qp2.com) and the Wall Street Journal (wsj.com). Historical data is from Barron's and ISI price books. The views expressed are provided for information purposes only and should not be construed in any way as investment advice. Furthermore, the opinions expressed may change without notice.
Mike Burk Archive |
© 2005-2022 http://www.MarketOracle.co.uk - The Market Oracle is a FREE Daily Financial Markets Analysis & Forecasting online publication.