


Markets Big Deflationary Downwave Quick Reference Guide...
Stock-Markets / Financial Markets 2015 Jul 20, 2015 - 01:50 PM GMTBy: Clive_Maund

 We are believed to be on the verge of another deflationary downwave, similar to or more severe than the one which drove the dollar spike - and commodity slump - between July of last year and March, and caused by an intensification of the debt crisis, with increasing capital flight out of Europe and into dollar assets as the EU crumbles. More QE will not save the situation, as it is already discredited and will have no more effect than trying to inflate a tire or rubber boat that has a big hole in it.
It is understood that in this modern age many readers have a very limited attention span, due to time constraints and the tendency to multi-task. For this reason this update is being kept short and to the point. It is intended to make plain in the clearest possible manner the scenario that is expected to unfold in the coming months. So let's get to it.
The only way to purge debt is to retrench - curb spending and balance the books. Modern governments have sought to avoid this responsibility for years now, by cheating and printing money out of nothing, because they are not subject to the discipline of a gold standard. The result of this is a towering debt and derivatives mountain that is set to bury them, despite their meddling in the markets to keep interest rates at zero to stop the debt compounding. Debt to GDP levels have risen to unsustainable levels in many countries around the world. This is why economies are weakening and standards of living are dropping, and the problem has now caught up with China. We are now caught in a downward deflationary spiral and it won't stop until the debt is purged or written off. The astronomic magnitude of the debt means that the situation could quickly get out of control leading to a global economic calamity. Few investments will be spared as the liquidation intensifies, and the dollar will be the prime beneficiary of this especially as a torrent of funds will flee Europe as it backslides into chaos.
That's enough of an introduction, now let's look at the charts starting with the dollar.
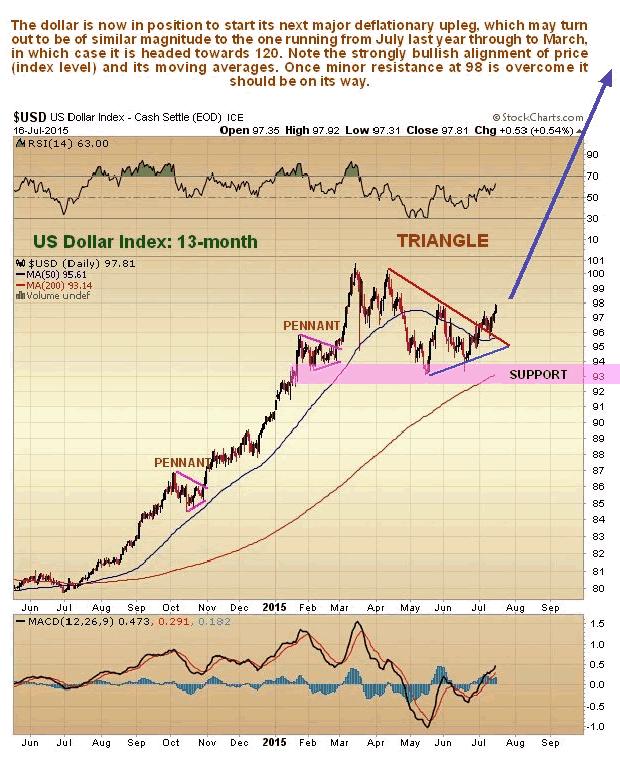
The dollar index chart looks very positive, with it now breaking out upside from a Triangular consolidation that allowed its earlier heavily overbought condition to unwind. Note the strongly bullish alignment of its moving averages. It is now in position to take off and this upleg is likely to be as big as the one that ran from last July to March - or bigger - meaning that it could advance towards 120.
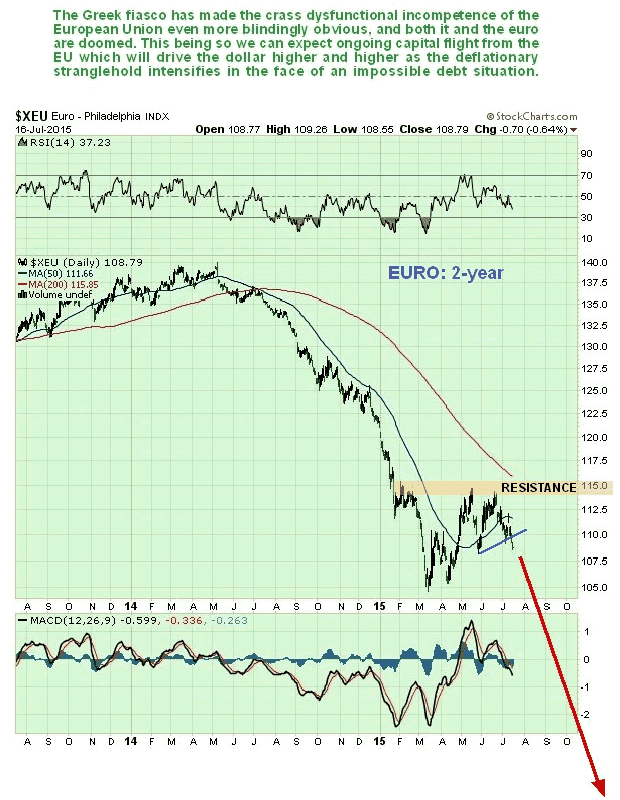
Of course, a big reason for the dollar's strength is the malaise of the dying euro (the dollar index is made up 57% of the euro), with the bungling incompetent actions of the EU's leaders in respect to Greece making plain to the world that they are unfit for office, and that the European Union will probably eventually unravel. Having seen what was done to Greece, we can be in no doubt that the leaders of Italy, Portugal, Spain will be considering their options. The euro look set to drop hard as shown on its 2-year chart below.
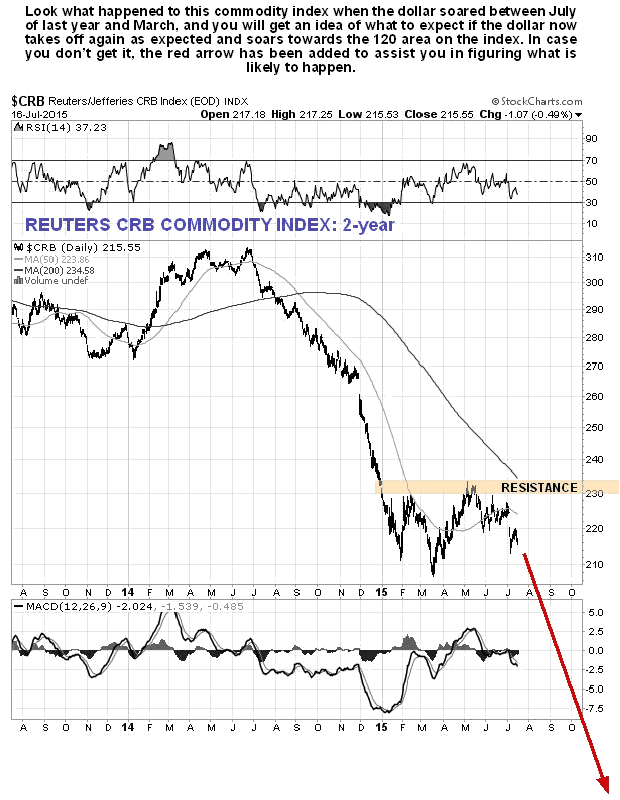
Of course a strongly rising dollar will wreak havoc on commodity prices, as it did when it rose strongly the last time, from July of last year through March. The commodity index shown below should plunge as shown by the red arrow.
Copper appears to have been marking out a massive top pattern on its long-term charts, and it looks set to plunge to strong support at its 2008 crash lows in the $1.25 area, and perhaps lower. Its COTs are currently quite bullish, so we may see a relief rally at some point. However, its key support has already failed some time ago and it is now very vulnerable.
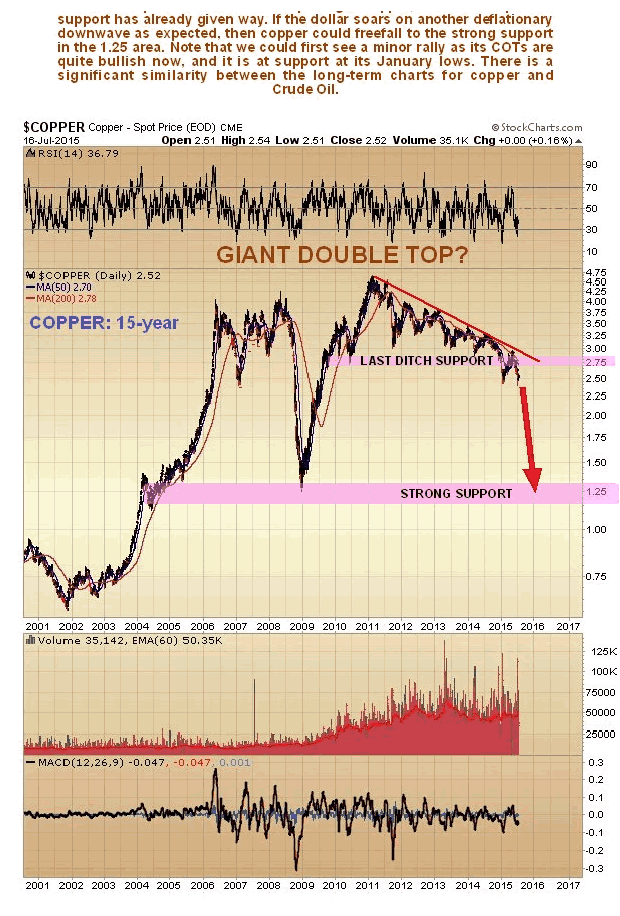
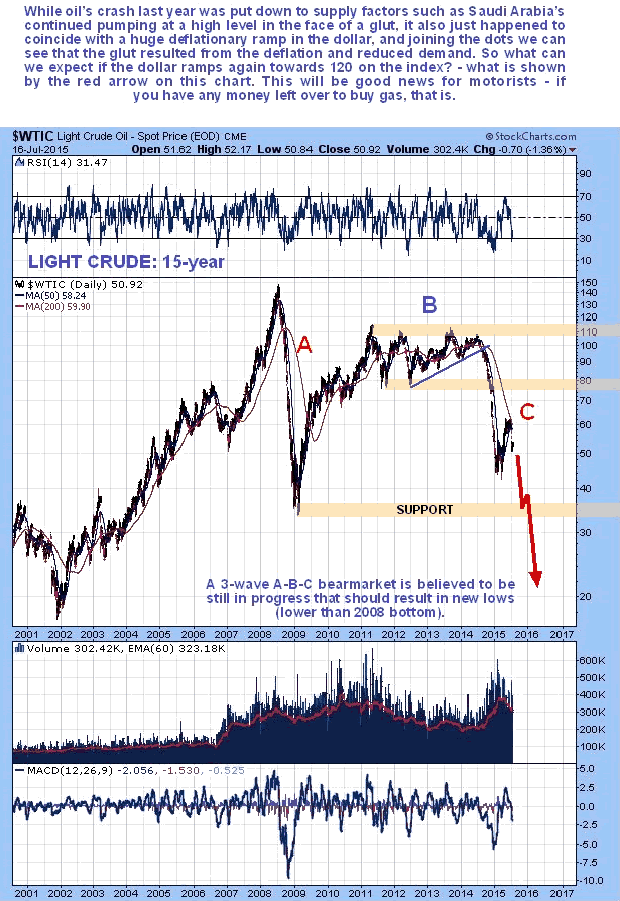
The oil chart has some similarities with copper, which is because they are both dropping due to deflation. Oil looks set to be particularly hard hit and may drop into the mid-$20's.
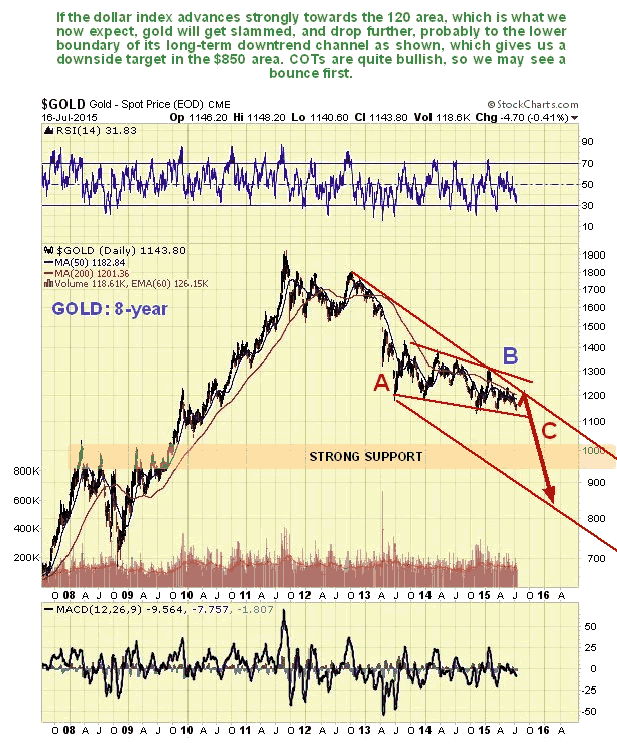
Gold, which has been struggling to find a footing for 2 years now, is expected to be forced into another downleg by another strong dollar upleg, and should drop to the $850 - $100 area, probably nearer to $850.
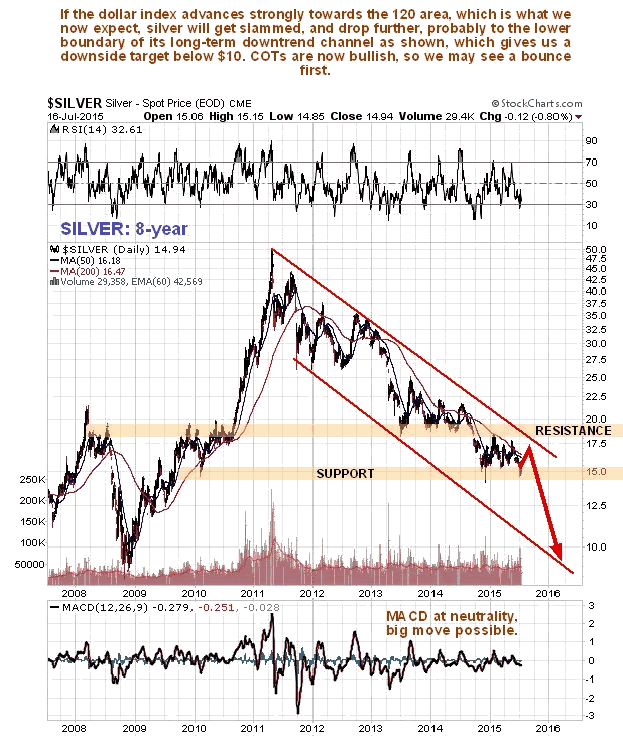
Silver will crash support and drop towards the lower boundary of its long-term downtrend channel, which means it may drop to below $10.
The scenario set out here is a grim prospect, it is true, because of its implications for many aspects of life, but it will considerably easier if you are on the right side of the trade - and we plan to be.
By Clive Maund
CliveMaund.com
For billing & subscription questions: subscriptions@clivemaund.com
© 2015 Clive Maund - The above represents the opinion and analysis of Mr. Maund, based on data available to him, at the time of writing. Mr. Maunds opinions are his own, and are not a recommendation or an offer to buy or sell securities. No responsibility can be accepted for losses that may result as a consequence of trading on the basis of this analysis.
Mr. Maund is an independent analyst who receives no compensation of any kind from any groups, individuals or corporations mentioned in his reports. As trading and investing in any financial markets may involve serious risk of loss, Mr. Maund recommends that you consult with a qualified investment advisor, one licensed by appropriate regulatory agencies in your legal jurisdiction and do your own due diligence and research when making any kind of a transaction with financial ramifications.
Clive Maund Archive |
© 2005-2022 http://www.MarketOracle.co.uk - The Market Oracle is a FREE Daily Financial Markets Analysis & Forecasting online publication.