Gold Price Seasonal Tendencies for July 2015
Commodities / Gold and Silver 2015 Jul 13, 2015 - 05:11 PM GMTBy: Mike_McAra
 “History doesn’t repeat itself but it rhymes” the saying goes. If this is in fact true, and what has happened before might imperfectly repeat itself in the future, this might be used in financial markets. But how to use it exactly? Is there a way to get clear indications as to what used to happen in the past to get a notion of what might come?
It is frequently difficult to quantify past events in a meaningful way to get an idea of the possible future tendencies. At Sunshine Profits, we have come up with a methodology to look at the past and recognize tendencies that might repeat themselves in the future – we have developed a tool called True Seasonals to analyze this sort of patterns.
Our approach is to look at historical periods: years, quarters and months. We look at those periods and establish how gold, silver and other assets used to behave in these periods. Based on that, we infer what their behavior might be in throughout the year, a given quarter or a given month. The details behind the process are slightly more complicated but the general idea is simple – to look at the past to try to get a sense of what might happen with a given asset.
Now this is what we would call seasonality – how gold and other assets behave in different parts of the year. “Sell in May and go away” is yet another saying. It suggests that one should sell gold and silver in May and wait until the fall to reenter the market. Our analysis of seasonal tendencies is actually able to pinpoint whether selling in May actually was, on average, a good idea.
Apart from simple seasonal tendencies, there is also on other kind of influence that keeps recurring throughout time. It is the expiration of derivatives. The market is full of rumors how the prices of gold and silver might be kept artificially low around the dates when gold and silver futures and options expire. Whether there is any substance in these claims remains largely questionable. But True Seasonals doesn’t stop at analyzing simple seasonality. It also takes into account the influence derivatives might have on precious metals and other assets. In a way, this is like having two tools in one package.
If you haven’t had the chance to do so yet, dive into our report on gold seasonality, which explains True Seasonals in greater detail. In the report, we read:
True Seasonals has two basic functions. The first identifies the seasonal influence on stock prices and assesses the risk connected with stocks. This function is able to indicate whether the prices of a stock are usually higher/lower during a particular part of year and whether the risk involved tends to be relatively high or relatively low. Various Internet blogs thrash out this very subject, but this function enables you to confront the buzz with real data.
The second function is similar to the first, but instead of identifying the price level and the risk throughout the whole year, it identifies these qualities on the dates of the expiration of derivatives, i.e. gold futures and options, as well as stock options. We designed this function to provide substantial evidence whether or not the expiration of derivatives influences the prices of precious metals. This matter has been the topic of a long-lasting public debate among precious metals investors. This tool puts the debate to rest.
We combined these two functions to produce True Seasonals, one of the most comprehensive tools based on seasonal influence and the first one to include the impact of futures and options, making it the best instrument to analyze recurring price changes.
So, the general idea is to look at a specific period during a year, say June and True Seasonals will give you the idea on how gold, silver or other assets used to perform, on average, in this period in the past – in this specific example this would be how gold used perform in July in the past. Seeing this performance could help you form an opinion on how gold might perform in July in the future.
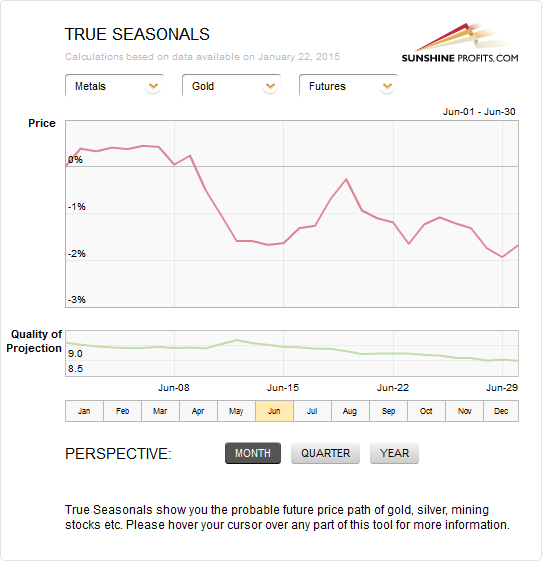
This will all become a lot clearer once we look at a real example. Let’s consider what True Seasonals would have shown you on May 31, 2015. We’re interested in gold and in a monthly horizon. Additionally, we want to consider the impact of the expiration of futures contracts.

We focus on the red line. It is the projected price path for gold for June. As we see, True Seasonals would have suggested on May 31, 2015 that gold would generally depreciate in June. They would have also indicated that there was to be a short-lived rebound in the second part of the month.
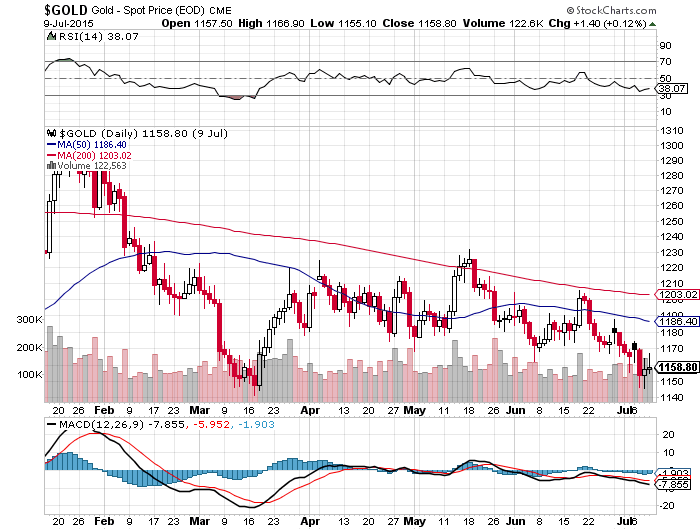
Now, let’s take a look at a chart showing the actual price for June 2015 (chart courtesy by http://stockcharts.com).

If we take a look at the period from the beginning of June (marked as Jun on the chart) to its end (Jul), we see that gold generally declined in June with a sharp and visible bounce in the second half of the month. This bears analogy to what would have been suggested by True Seasonals. The analogy is not perfect but just as we have written earlier “history doesn’t repeat itself, it rhymes.” Meaning that the analogies between past and present events might not be perfect, but they might be useful nonetheless.
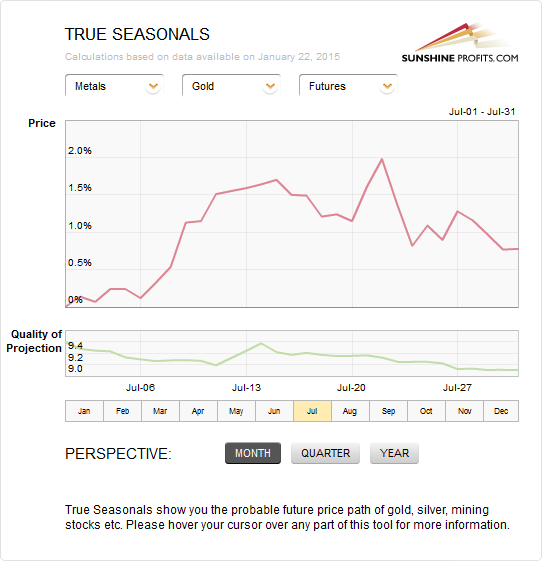
Now, let’s take a look at what True Seasonals suggest for July.

The tool suggests appreciation in the first part of the month but depreciation later on. As it turns out (take a look at the previous chart), there was a move up in the first part of July and it was quickly followed by sharp depreciation. Again, this is not in perfect accordance with the price path suggested by the tool, but it bears resemblance, at least to some extent.
One thing to bear in mind is the importance of the Quality of Projection measure. Our report (pdf) on gold seasonality explains:
How reliable are True Seasonals? What is the “quality” of the predicted prices? Is it the same no matter what or highly precise at some times and less so at others? Such information could help you decide when it is imperative to use our tool and when it is only optional.
Our research team has come up with an answer. Exclusively for this tool and available only at Sunshine Profits, we have designed and implemented a unique measure – Quality of Projection (QoP). You can immediately assess the quality of a predicted price of a particular asset and decide if you want to use True Seasonals in your investment decisions. Moreover, QoP allows you to compare the usefulness of predictions of different stocks and choose the prediction that suits your needs. QoP is based on a 10-point scale where 10 means that on a particular day the prices of a stock used to be very stable and therefore the risk connected with the prediction is relatively low – the quality of the prediction is extremely high and therefore needs to be included in your analysis. To the contrary, 0 and negative values mean that the prices of a stock has been volatile and the quality of prediction is extremely low, investment more risky and the use of True Seasonals only optional.
Now, take a look at the chart again. The QoP is relatively high throughout the projection period but it also has a local bottom in the first half of the month, roughly coinciding with the discrepancies between the tool and the actual price path. This stresses the importance of using the QoP measure. Also, note that True Seasonals are to be used in conjunction with other tools. For instance, if there are strong technical signals in the market, they might take precedence over the indications of the tool.
If we were to look at the second part of July, True Seasonals suggest depreciation. However, there are also factors other than seasonality at work in the precious metals market. We cover these factors at length in our Gold & Silver Trading Alerts. To get the whole picture, you could combine the analysis from Gold & Silver Trading Alerts with the analysis from True Seasonals.
Please, be aware that no representation is being made that the patterns shown by True Seasonals will actually materialize in the future. Mind that the relationships in the precious metals market are not stable and might change over time.
If you enjoyed the above discussion of gold seasonality and our analysis, we encourage you to stay up-to-date with our free articles and alerts - sign up for our gold mailing list today. It’s free and if you don’t like it, you can easily unsubscribe.
Thank you.
Regards,
Mike McAra
Bitcoin Trading Strategist
Bitcoin Trading Alerts at SunshineProfits.com
Disclaimer
All essays, research and information found above represent analyses and opinions of Mike McAra and Sunshine Profits' associates only. As such, it may prove wrong and be a subject to change without notice. Opinions and analyses were based on data available to authors of respective essays at the time of writing. Although the information provided above is based on careful research and sources that are believed to be accurate, Mike McAra and his associates do not guarantee the accuracy or thoroughness of the data or information reported. The opinions published above are neither an offer nor a recommendation to purchase or sell any securities. Mr. McAra is not a Registered Securities Advisor. By reading Mike McAra’s reports you fully agree that he will not be held responsible or liable for any decisions you make regarding any information provided in these reports. Investing, trading and speculation in any financial markets may involve high risk of loss. Mike McAra, Sunshine Profits' employees and affiliates as well as members of their families may have a short or long position in any securities, including those mentioned in any of the reports or essays, and may make additional purchases and/or sales of those securities without notice.
Mike McAra Archive |
© 2005-2022 http://www.MarketOracle.co.uk - The Market Oracle is a FREE Daily Financial Markets Analysis & Forecasting online publication.


