


Financial and Commodity Markets Become Scary: Crash Point Or Turning Point?
Stock-Markets / Financial Markets 2015 Jul 05, 2015 - 04:56 PM GMTBy: GoldSilverWorlds

 We cannot remember having seen so many markets at critical points simultaneously. It is truly astonishing. Scary movie or turning points? We do not know for sure, but let’s review the strategic assets in order to get an understanding of the likely scenarios going forward.
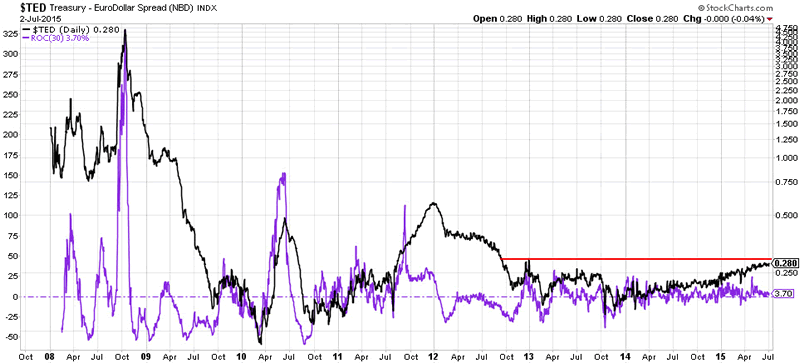
First and foremost, the TED spread is about to cross a critical resistance level. We look at the TED spread as a fear indicator, a signal that a correction is coming. The steady rise of the TED spread since last summer is not a healthy signal. The trillion dollar question is how far it will go, and which markets it will hit.
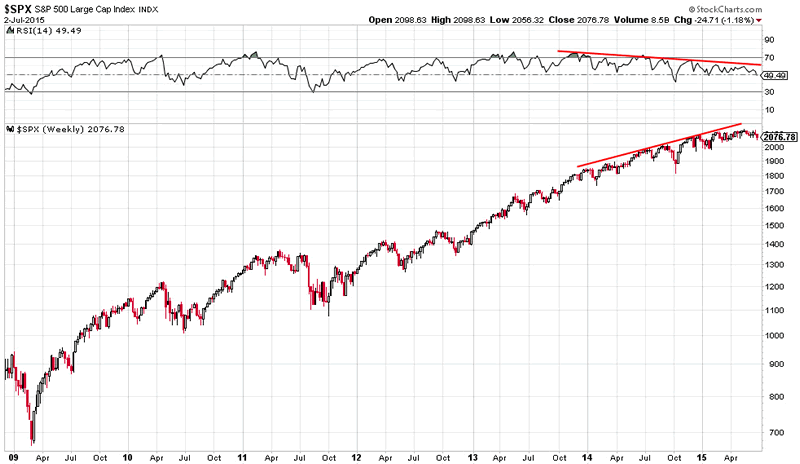
If anything, the stock market seems to be the best candidate for a severe correction. Purely from a trend perspective (without engaging in technical analysis), it seems that the broad markets have lost momentum, as evidenced by the S&P500 momentum (RSI) versus price divergence. For now, it seems that the path of least resistance will be lower.
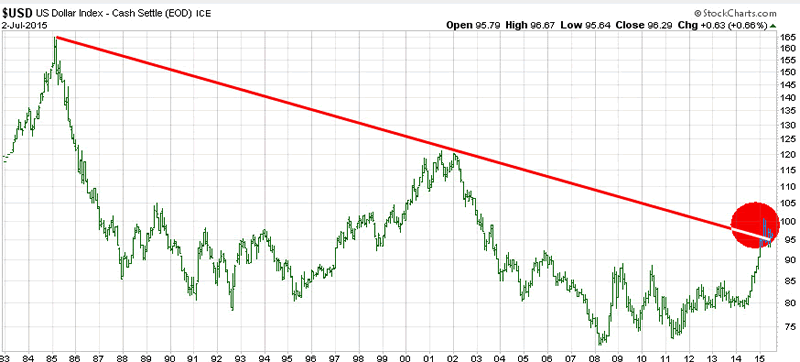
There is more, much more in fact. The dollar is standing at a critical juncture which has been built since three decades. Again, we do not engage in technical analysis, but focus only on secular chart patterns. Those patterns reveal that the dollar is sitting right at a giga-trendline. If the dollar were to trend higher in the coming weeks and months, we would interepret it as strongly deflationary. On the other hand, we see a false breakout in the chart, indicated with the red circle, which could mean that the secular downward trend is still intact. One thing is clear: the dollar is at a gigantic make or break level.
Meantime, several key commodities have arrived at another structural decision point, particularly Dr. copper, gold and silver.
Dr. Copper, the indicator of the health of the global economy, is going to tell us shortly what to think of the state of the economy. As the next chart shows, we are right at the apex of a mega trend (triangle); its formation is 14 years in the making.
copper_2001_June_2015-590
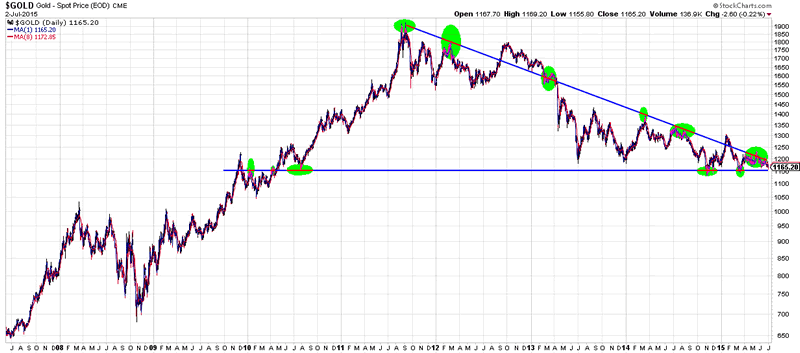
Gold, the monetary commodity, has also arrived at a critical point. Although the triangle on its chart goes back to 2008, slightly less impressive than copper, it also tells us it is make or break time.
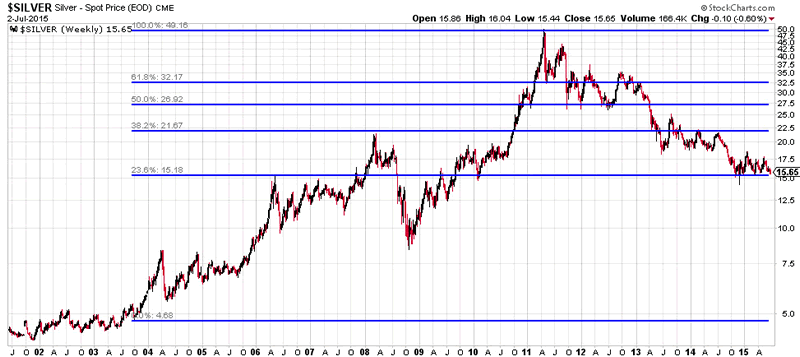
Unsurprisingly, silver has reached the last retracement level of it’s secular uptrend which started in 2004. It goes without saying that this is a critical oint.
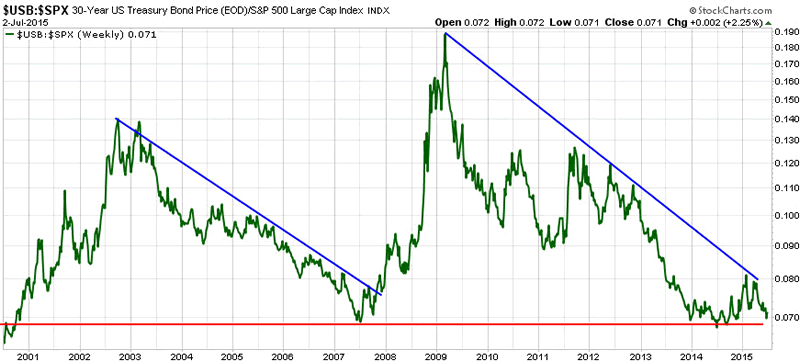
Last but not least, the U.S. bond to stocks ratio is arriving at a decision level as well, although there is still some room within the ongoing pattern. A break outside this pattern could signal a similar situation as in 2008: stocks are about to undergo a (severe?) correction, while bonds would appreciate. The issue here is that there is not much room left for bonds to rise, given the multi-decade low yields. Let’s be clear: we will have one of the following three scenarios: either a crash in the bond market, or lower yields than we have today (in other words, negative yields across the board), or a severe correction in stocks.
It is truly exceptional to see so many strategic assets at critical junctures, simultaneously. It seems that a stock market correction is becoming clearer with the day. On the other hand, the commodities we discussed could go both directions: up or down. A declining stock market seems is likely to lead copper lower. Could gold and silver react as a safe haven, given the ultra low yields in bonds? Or will investors chose for bonds, driving yields even lower, and making the world we live in even more crazy than it is today?
From our point of view, in a world flooded by paper assets, it seems obvious that tangible assets should be watched closely. In case of a deflationary bust, real assets will preserve relatively more value than other assets, even as their prices decline because prices of paper assets will decline faster. In case our monetary masters will intervene with more stimulus programs, in their attempt to create inflation, we should see tangible assets rise as well. So in our view, commodities should be part of a diversified portfolio.
That is why we are focusing on stevia, nickel and uranium in the next Commodity Report.
Source - http://goldsilverworlds.com/
© 2015 Copyright goldsilverworlds - All Rights Reserved Disclaimer: The above is a matter of opinion provided for general information purposes only and is not intended as investment advice. Information and analysis above are derived from sources and utilising methods believed to be reliable, but we cannot accept responsibility for any losses you may incur as a result of this analysis. Individuals should consult with their personal financial advisors.
© 2005-2022 http://www.MarketOracle.co.uk - The Market Oracle is a FREE Daily Financial Markets Analysis & Forecasting online publication.