


Gold Price Approaching An Endpoint
Commodities / Gold and Silver 2015 Jun 16, 2015 - 06:00 AM GMTBy: Bob_Loukas

 Apart from two mini-peaks at recent Daily Cycle (DC) tops, Gold's current Investor Cycle has traded in a narrow, horizontal range. The Investor Cycle (IC) began with 10 good trading days back in March, but has since moved sideways. If the bulls were back in control of the gold market, they would driven Gold to make much more significant gains during the early favorable IC periods (first 8 weeks). Despite being in the most favorable (early) part of the Investor Cycle, Gold failed to catch the bid necessary to move it higher, and has now entered the IC's normal period of decline. (Note: A Daily Cycle is measured in trading Days. Investor Cycle measured in weeks. See Glossary of Cycle terms)
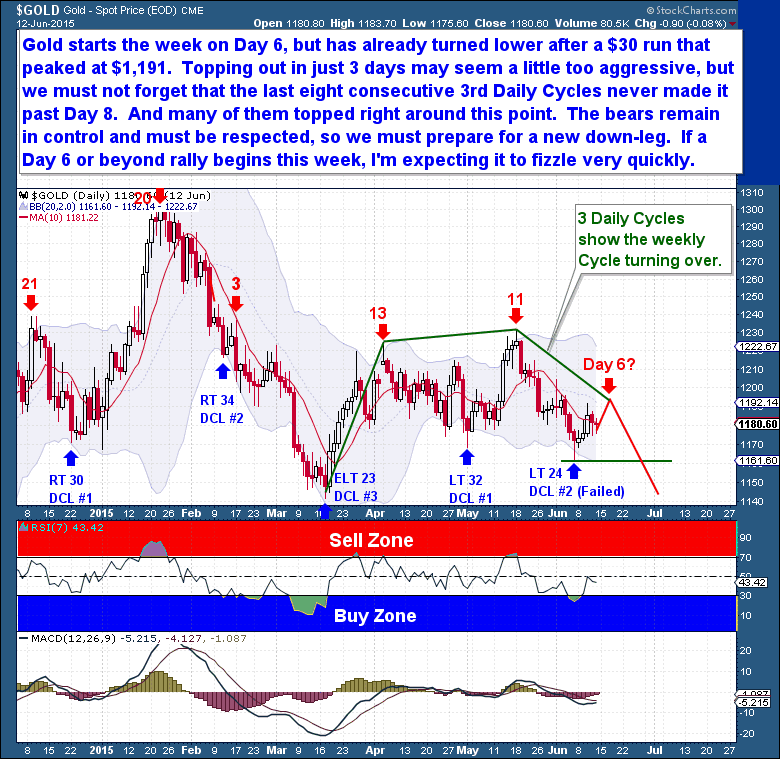
During the past 4 years, each Investor Cycle within this bear market decline was already well into decline by week 13 - where the current IC rests. On the daily chart, Gold is sporting a new series of lower lows, and it's likely it will soon have a series of lower highs as well. In short, the daily chart shows the arc (green line) of an Investor Cycle that has moved into decline. After a $30 run that peaked at $1,191, Gold will start the week on day 6 of the current DC and has begun to turn lower. Although a top after only 3 days may seem aggressive, it's important to remember that the last eight 3rd Daily Cycles did not make it past day 8.
A significant component of Cycle study focuses on identifying the type of Cycle an asset is following, and correlating that Cycle type's typical performance to the asset. When a strong identification is possible, as with Gold today, the predictability of future performance is generally very high. So for the moment, we can only conclude that the bears remain in control, and that Gold is showing a setup only a bear could love. Based on these charts and longer term Cycle counts, we should prepare for a new down-leg. If another rally were to materialize this week, I'd expect it to be modest and to fizzle very quickly.
Shifting to the precious metals Miners, a look at recent performance shows that they have actually held up relatively well. But they, too, are no longer rising and have begun to languish. And history shows that the Miners don't perform well when they trade in a low volatility, slow motion decline as at present. Very often, when a Gold Cycle ages, the Miners are the first asset to give way in a waterfall decline into an Investor Cycle Low (ICL).
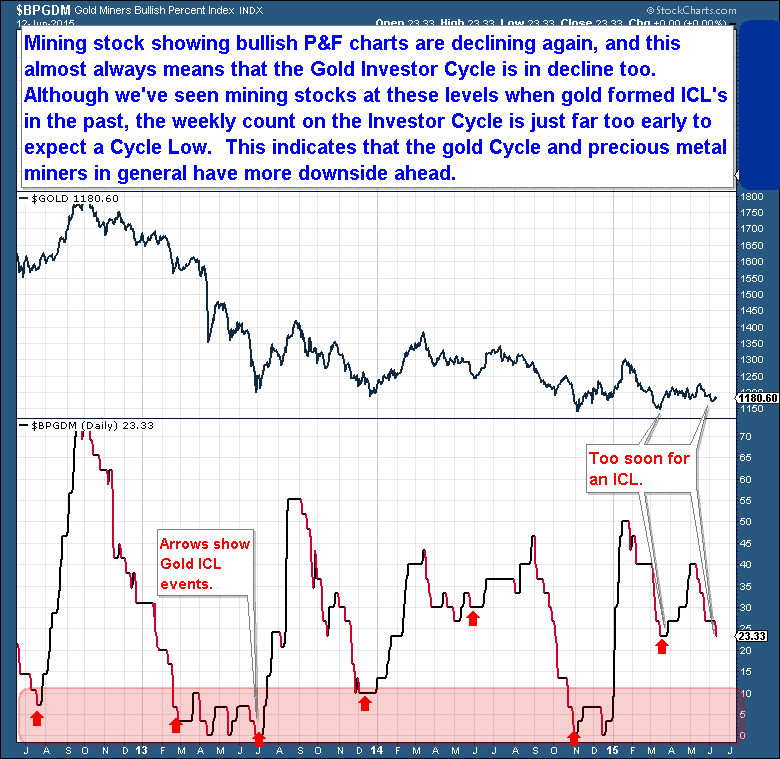
In addition, the percentage of mining stocks showing bullish P&F charts (the BPGDM index) is declining, and this typically means that the Gold Investor Cycle is in decline too. That makes sense, as Gold is showing a failed Daily Cycle. Even though the BPGDM at current levels has, in the past, been accompanied by a Gold ICL, Gold's current weekly IC count is far too early (Week 13 of 20-24 week Cycle) to expect that we are seeing an ICL. So the Gold Cycle and precious metal Miners are likely to see more downside in the coming weeks.
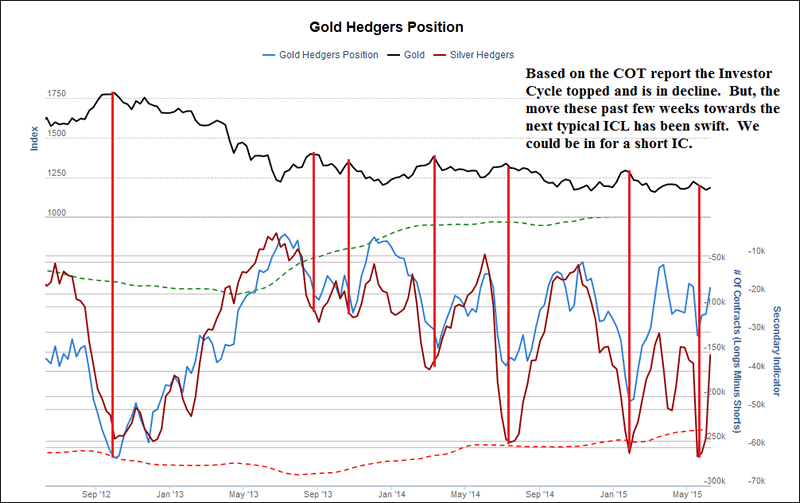
Amidst all of the negative signs for Gold, it's worth mentioning one bright spot - the sudden and powerful change in the COT reports. Again, it's far too early for an ICL, but the COT report reflects that Gold has moved lower and is not all that far away from ICL levels. Though it's not my primary expectation, this could be a harbinger of a short Investor Cycle, one that could end when the current Daily Cycle finds a Daily Cycle Low (DCL) over the next 3 to 5 weeks. The primary point is that Gold is well into the declining portion of its Investor Cycle.
Courtesy Sentimentrader.com
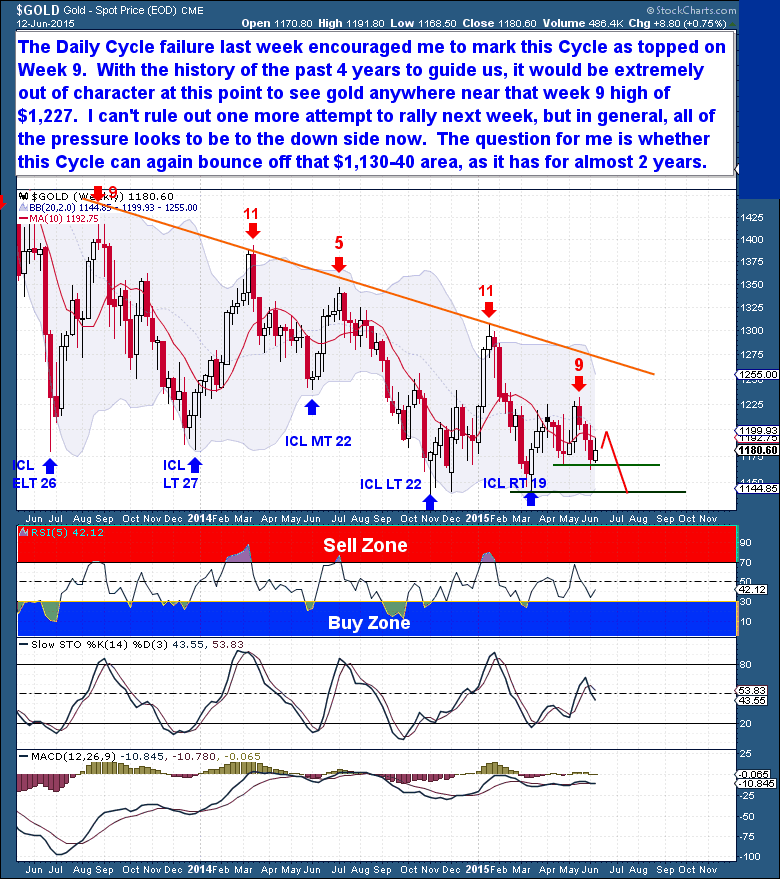
Earlier, we discussed Gold's current sideways price action. The weekly chart (below) highlights the anemic nature of Gold's rise during the current IC, which is largely attributable to poor 1st and 2nd Daily Cycles. Gold didn't see the significant rise early in the IC that it normally does. In this case, I would have expected Gold to approach the large, declining trend-line, but that didn't happen. Gold now appears ready to resume its long term downward trajectory.
The Daily Cycle failure last week encouraged me to conclude that current IC topped on week 9. With 4 years of similar Cycle action as a reference, it would be extremely unusual at this point to see Gold move anywhere near the week 9 high ($1,227). It's impossible to rule out one more attempt to rally next week, but in general, pressure should come from above, and will likely attempt to force a Gold Investor Cycle failure (below $1,136).
The question today is not whether Gold can recover and surprise to the upside. Rather, it's whether Gold can manage to hold the $1,130-40 area during the coming ICL. For 2 years, through the last 4 Investor Cycles, Gold has held above that level, so many believe that it will do so again. But the general rule in technical analysis is that repeated attempts to break a support line will eventually succeed. Just as, during the 2012-13 period, multiple attempts to break the $1,520 area period eventually succeeded and led to major capitulation, there is a real possibility that Gold could punch through support and cascade lower.
The Financial Tap publishes two member reports per week, a weekly premium report and a midweek market update report. The reports cover the movements and trading opportunities of the Gold, S&P, Oil, $USD, US Bond's, and Natural Gas Cycles. Along with these reports, members enjoy access to two different portfolios and trade alerts. Both portfolios trade on varying time-frames (from days, weeks, to months), there is a portfolio to suit all member preferences.
You’re just 1 minute away from profitable trades! please visit http://thefinancialtap.com/landing/try#
By Bob Loukas
© 2015 Copyright Bob Loukas - All Rights Reserved
Disclaimer: The above is a matter of opinion provided for general information purposes only and is not intended as investment advice. Information and analysis above are derived from sources and utilising methods believed to be reliable, but we cannot accept responsibility for any losses you may incur as a result of this analysis. Individuals should consult with their personal financial advisors.
© 2005-2022 http://www.MarketOracle.co.uk - The Market Oracle is a FREE Daily Financial Markets Analysis & Forecasting online publication.