Central Banks Predict Gold Market - But Not The Way You Think
Commodities / Gold and Silver 2015 Jun 09, 2015 - 10:34 AM GMTBy: EWI
 By Bob Prechter, Elliott Wave International
Editor's note: This article was adapted from a new multimedia report, "The New Financial Theory that Could Make the Difference in Your Investing Success," from Elliott Wave International, the world's largest financial forecasting firm. Authored by Robert Prechter, the full report demonstrates the failures of the modern investing paradigm and suggests a radically new approach that makes the difference in your investing success. Click here to read and watch the full multimedia report -- it's free.
Back when I worked at Merrill Lynch in the 1970s, I studied a number of data series useful for technical analysis. Bob Farrell had odd-lot buying and selling data going back decades, a rare treasure. Hardly anyone was buying and selling in odd lots anymore, but I wanted to see if any useful pattern emerged.
I found that the old saw that odd-lotters are always wrong is not quite accurate. Their behavior went like this: Most of the time when the market rose, odd-lotters would sell into the advance, and most of the time it fell, they would buy into the decline. But their behavior would change right at the turns. Suddenly on a plunge to a new low in the market, the odd-lotters would sell into the decline. It meant that their psychology had flipped from believing the market was offering bargains to believing it would go down much further. The change of opinion was so powerful that they continued selling long after the market subsequently turned up. The reverse would happen at tops: They would sell into the rise until near the end, then they would buy into the last rally. When the market turned down, they would keep buying for a long time.
This information turned out to be useful. Merrill Lynch kept in-house data on the aggregate activity of cash and margin accounts. Margin account owners tend to be trend followers; in the aggregate, they increase buying as the market rises and increase selling as it falls. Cash account owners tend to do the opposite; they increase selling as the market rises and increase buying as it falls -- except at the turns. So, activity in cash accounts mirrors that of the old odd-lot series. I recall cash accounts selling into the 1975-1976 advance until near the end, and then they bought during the final surge.
After leaving Merrill, I no longer had access to these data. But the insight wasn't wasted. It seems that one institutional group behaves in the same manner as the old odd-lotters: central bankers.

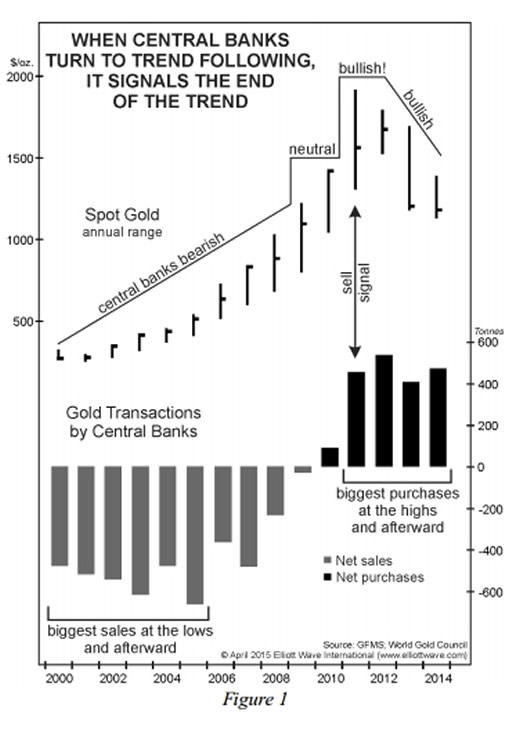
Figure 1 shows that central bankers were selling their heads off at the final bottom in gold in 1999-2001. When the bull market started, they increased their sales, reaching a peak rate of selling in 2005. They continued to sell right into the deepest decline of the bull market, which occurred in 2008. Over the next two years, as gold took off again, they slackened their rate of selling and then edged toward becoming slight net buyers in 2010. Activity for 2009-2010 indicated a neutral stance for those years, as central-bank vaults sat depleted and gold continued to rise. Finally in 2011, the year of the top, they couldn't stand it anymore. They reversed course for the first time in well over a decade and started buying gold heavily, during the final rise to the highest gold prices ever. Silver reversed into a bear market in April that year. Gold finally peaked in September and crashed $400/oz. in a month. After gold's initial plunge, it rallied through most of 2012, and central banks, believing they were being offered bargains on the way to far higher prices, bought at an even faster rate. Perfectly mirroring odd-lotter behavior, they have continued to buy heavily all the way down. In other words, in the year of the top they decided the long term trend was up, so they chased the market, and every down year since has looked to them like an opportunity to buy more gold at "bargain" prices.
When the bear market in gold approaches its end, central bankers will finally reverse the trend of their transactions and sell into the downtrend. When they do, it will signal the final price decline into the next major bottom.
The market is nowhere near this point. In fact, central bankers bought more gold last year than they did the year before. Study the chart and you will see that this behavior is like that of 2003 but in reverse. Back then they kept thinking a bear market rally had ended, and since the top they keep thinking a correction in a bull market has ended. Their persistent buying fits the long term bear market outlook we have long been advocating.
This article was excerpted from a new multimedia report, "The New Financial Theory that Could Make the Difference in Your Investing Success," from Elliott Wave International, the world's largest financial forecasting firm. Authored by Robert Prechter, the full report demonstrates the failures of the modern investing paradigm and suggests a radically new approach that make the difference in your investing success. Click here to read and watch the full multimedia report -- it's free.
About the Publisher, Elliott Wave International
Founded in 1979 by Robert R. Prechter Jr., Elliott Wave International (EWI) is the world's largest market forecasting firm. Its staff of full-time analysts provides 24-hour-a-day market analysis to institutional and private investors around the world.
© 2005-2022 http://www.MarketOracle.co.uk - The Market Oracle is a FREE Daily Financial Markets Analysis & Forecasting online publication.


