Stock Markets Heading for Test of March Lows
Stock-Markets / US Stock Markets Jun 16, 2008 - 04:48 AM GMTBy: Andre_Gratian
 Current Position of the Market
SPX: Long-term trend -
So far, the market has followed the decennial pattern in an election year. But the 6-yr cycle which is scheduled to bottom in the Fall could play a restraining role, followed by an eventual bull market top in 2009-2010.
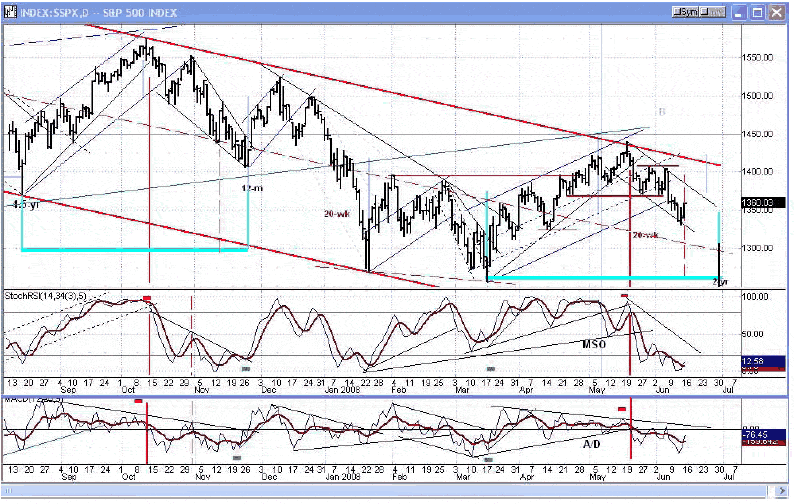
SPX: Intermediate trend - The intermediate correction came to an end on 3/17 at 1257. After a tentative uptrend to 1440, the index is now is in the process of testing its March low and expanding its base.
Analysis of the short-term trend is done on a daily basis with the help of hourly charts. It is an important adjunct to the analysis of daily and weekly charts which determines the course of longer market trends.
Daily market analysis of the short term trend is reserved for subscribers. If you would like to sign up for a FREE 4-week trial period of daily comments, please let me know at ajg@cybertrails.com .
Overview:
The stock market is still correcting in a mixed fashion. The financial indices are the weakest followed by the large caps. Techs and small caps are the strongest. The SPX is somewhere in the middle. Having rallied from its low of 1257 in March to 1440 in May, it is now expanding its intermediate trend correction and should continue to do so for another week or two.
I have previously discussed the need for this expansion as a result of this year's cyclic configuration, one influence being the 8th year of the decennial pattern. Markets tend to correct into the first 3 months of the year and then rally, and this is what we did in 2008. But I also felt that other important cycles would cause a retracement before we could challenge the previous highs of October 2007, and I lumped the cycles which would cause this retracement into one group due in late summer early Fall.
As it turns out, there are two distinct groups of cycles which will affect the market. One cycle is currently bottoming and should be ready to reverse around the end of the month putting in place an important low, and the others will not do so until October.
We can therefore expect the current downtrend to continue for a short while and to make lower lows before we can have a strong reversal. The cycle which is now in charge is very dominant.
Although many analysts have called the decline from October 2007 the beginning of a bear market, I have never felt that it was and that this call was premature. Instead, I believe that the stock market is still following a typical decennial pattern which calls for one more high in 2009 or 2010 before we do start a bear market as a result of the powerful cycles which will bottom between 2012 and 2014. The low which is shaping up over the next couple of weeks is likely to hold above that of March, after which will begin an uptrend which should exceed 1440 on the SPX, but it may still fall short of the October high until the Fall cycles have made their lows.
What's ahead?
Chart pattern and momentum:
The fractal similarity of the patterns underscored by a heavy light blue line on the daily SPX chart below continues and is now becoming more and more apparent. There is a good chance that it will last to the very end, since the current decline is anticipated to persist into the end of the month. The vertical red dashes represent where we are on the fractal, and the light blue vertical line where it is likely to end.

I am not expecting the pattern to be exactly identical in length or form to the very end, and will depend on my indicators to determine when the low is being made. As you can see, both the momentum and breadth indicators are still in a downtrend. If history repeats itself once again, I would expect patterns of positive divergence to form in both before the decline is complete. It will take a few more days and additional lows to do this, but we are getting very close. This is why I do not think that the SPX will surpass its March low before reversing. As you will see, projections seem to bear this out.
After the low has been made, the index should move out of the intermediate channel which is outlined in red on the chart.
Cycles
The last newsletter stated: Other cycles and CITs affecting the short-term in the near future will be a minor cycle due in the middle of next week, and two CITs due around 6/10-11.
It missed by one day! The short-term low came on the 12th and, so far, has produced a 30-point rally. But by Friday the SPX reached its minimum short-term projection and the hourly indicators were already showing negative divergence, so it is questionable how much more remains in the rally.
The longer cycle which is the cause of the current decline is the 2-year cycle. I had thought that it might bottom in late Summer or Fall as part of a nest of cycles all related by their various subdivisions to the 12-yr cycle, but upon reviewing its previous phases, I came to the conclusion that it was an entity unto itself which normally made its low in July, while the 3 and 6 year cycles are more likely to bottom in October.
Short-term cycles are scheduled to make their lows on the following dates: 6/23 and 7/1-2. Somewhere around there is when the longer cycle should ideally make its low as well.
Projections:
The 1440 top on the SPX coincided with the 1438 projection which had been given earlier. Since then, 1350 and 1337 were projected for the current decline. The 1350 level only held for a couple of days, and then the SPX declined to the lower target which it surpassed by 5 points before rebounding. The rally projection was given to subscribers as 1360-1365. On Friday, after some hesitation, the SPX finally moved up to 1360 where it closed. Because of the momentum which was developed at the close on Friday, there could be an extension of the move into Monday morning, achieving the full projection of 1365 or going slightly higher, but the last minute buying may have been caused by short-covering and may not have enough legs to follow through.
After the decline resumes, the projection for the new low will be somewhat dependent on how far up this rally goes. Right now, about 1300 looks likely, but if there is a climactic bottom, 1278 or a little lower could be reached.
Breadth
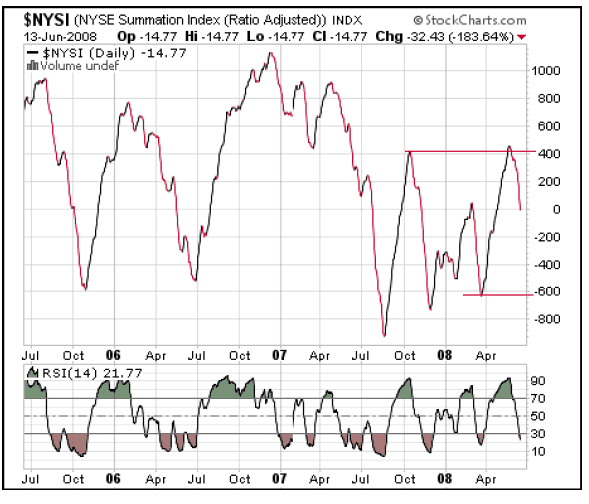
I believe that analyzing the breadth/price relationship is one of the most important factors in forecasting, and one of the best tools to analyze intermediate breadth is the McClellan Summation Index which appears below (courtesy of StockCharts). One of the reasons that I do not believe that we are in a bear market is because such a forecast is not supported by this index.
First, note that the SPX March low occurred after the index had already made two higher lows and therefore displayed positive divergence. Next, you can see that the SI had already risen slightly above its October 2007 high before turning down, while the SPX rolled over some 140 points below its comparable top. This is also positive divergence.
Finally, the RSI of the Summation Index is already at an oversold level, signaling that the index should turn up before too long, which coincides with what other indicators are saying about price. The current level of the SI itself is still far above its former low, suggesting that it will probably make another higher low and then continue its uptrend. Hence! No bear market in sight!
The shorter-term breadth indicator is still in a downtrend, as you can see on the chart above. When the McClellan oscillator turns up and rises above "0", the SI will resume its uptrend.

Market Leaders and Sentiment
GE and the NDX continue to diverge. GE is still declining but close to making its low as is suggested by the fact that its indicators are retaining their positive divergence. The stock is being influenced by the financial sector which continues to be very weak with the Banking Index making a new low last week.
On the other hand, the NDX is one of the strongest index on the exchange, along with the Russell 2000. Since both of these indices have an historical reputation as market leaders, they are telling us the same story as the McClellan Summation index. When the 2-yr cycle has made its low, we should continue the intermediate uptrend.
In January 2008, the AAII Bull Ratio 4-wk moving average made a low which was only recently exceeded in 1990. That was an indication that we were at or near a major bottom. Since then, it has moved up with the market rally, but already retraced to a point close to its oversold (bullish) range.
Summary
The decline from 1440 should come to an end within a couple of weeks and make another important low which will probably turn out to be a successful test of the March bottom.
The following are examples of unsolicited subscriber comments:
What is most impressive about your service is that you provide constant communication with your subscribers. I would highly recommend your service to traders. D.A.
Andre, you did it again! Like reading the book before watching the movie. B.F.
I would like to thank you so much for all your updates/newsletters. As I am mostly a short-term trader, your work has been so helpful to me as I know exactly when to get in and out of positions. I am so glad I decided to subscribe to Turning Points… Please rest assured that I shall continue to be with Turning Points for a long time to come. Thanks once again! D.P.
But don't take their word for it! Find out for yourself with a FREE 4-week trial. Send an email to ajg@cybertrails.com .
By Andre Gratian
MarketTurningPoints.com
A market advisory service should be evaluated on the basis of its forecasting accuracy and cost. At $25.00 per month, this service is probably the best all-around value. Two areas of analysis that are unmatched anywhere else -- cycles (from 2.5-wk to 18-years and longer) and accurate, coordinated Point & Figure and Fibonacci projections -- are combined with other methodologies to bring you weekly reports and frequent daily updates.
“By the Law of Periodical Repetition, everything which has happened once must happen again, and again, and again -- and not capriciously, but at regular periods, and each thing in its own period, not another’s, and each obeying its own law … The same Nature which delights in periodical repetition in the sky is the Nature which orders the affairs of the earth. Let us not underrate the value of that hint.” -- Mark Twain
You may also want to visit the Market Turning Points website to familiarize yourself with my philosophy and strategy.www.marketurningpoints.com
Disclaimer - The above comments about the financial markets are based purely on what I consider to be sound technical analysis principles uncompromised by fundamental considerations. They represent my own opinion and are not meant to be construed as trading or investment advice, but are offered as an analytical point of view which might be of interest to those who follow stock market cycles and technical analysis.
Andre Gratian Archive |
© 2005-2022 http://www.MarketOracle.co.uk - The Market Oracle is a FREE Daily Financial Markets Analysis & Forecasting online publication.


