Gold Sector Big Picture
Commodities / Gold and Silver 2015 Jun 01, 2015 - 03:09 PM GMTBy: Gary_Tanashian
 On shorter time frames the gold sector has been viewed as being on an 'anti-USD' inflation bounce. This bounce scenario in gold stocks and commodities took a hit last week with the US dollar's strong bounce.
In NFTRH we are managing things on both short and long time frames, with the short-term currently tied to movements in the USD. On the long-term however, things appear to be setting up for the next big macro play. The following charts are used for big picture updates to give perspective to the shorter-term work we do each week in NFTRH.
Gold Sector Update (Big Picture)
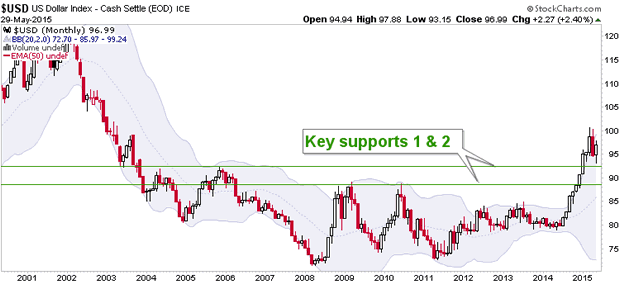
First and foremost, let's deal with the elephant in the room, Uncle Buck. The US dollar is in a cyclical bull market, subject to short-term corrective activity. This bull market is a component to a coming bull market in gold mining shares because the same things that would drive up gold vs. commodities (including silver) and gold vs. stock markets can drive up the world's reserve currency, USD. That would be a rush for liquidity amidst economic contraction (which itself would be at least partially instigated by USD strength).

In short, a backdrop of economic deceleration, waning asset speculation and a lurch by market participants toward 'risk off' liquidity would drive up the US dollar, and also gold's ratio to most assets. This is a positive for gold miner fundamentals (reference gold vs. mining cost-input crude oil as one example).
Yet ironically, the first leg of USD's bull market has been driven by speculation about rising interest rates due to a degree of economic strength stimulated by inflationary monetary policy. It is confusing folks, but it makes sense. We have long called the USD and the Gold-Silver ratio the 2 Horsemen. When they ride together, they will bring on the best environment for gold mining. This would confuse inflationist gold bugs, but would be in line with our view of the gold sector as counter-cyclical, not cyclical as most commodities tend to be.
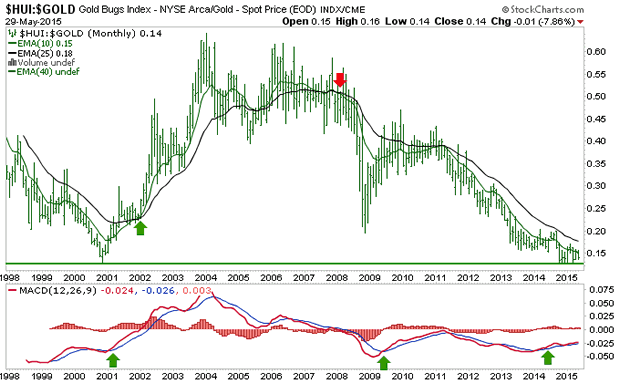
Moving on, we see that the senior gold miners vs. gold (HUI-Gold ratio) are still on a bear signal, but have come to support defined as the 2000 low. This does not mean that the miners are quite the value they were in 2000 however, since there has been a lot of share dilution since then. But it is safe to say that given the right macro backdrop, the miners would be seen as a 'value'.

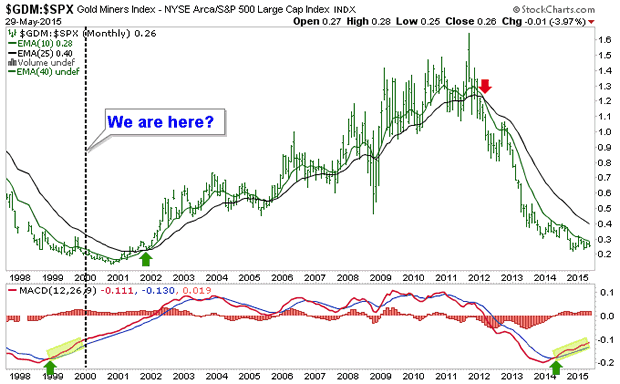
The GDM Gold Miners index vs. the S&P 500 shows a great risk vs. reward situation for the gold sector vs. the broad market. But if we are to use the 1999-2001 time frame as a guide, the play is probably not quite baked yet. On a 2 year horizon however, where is the risk and where is the reward?

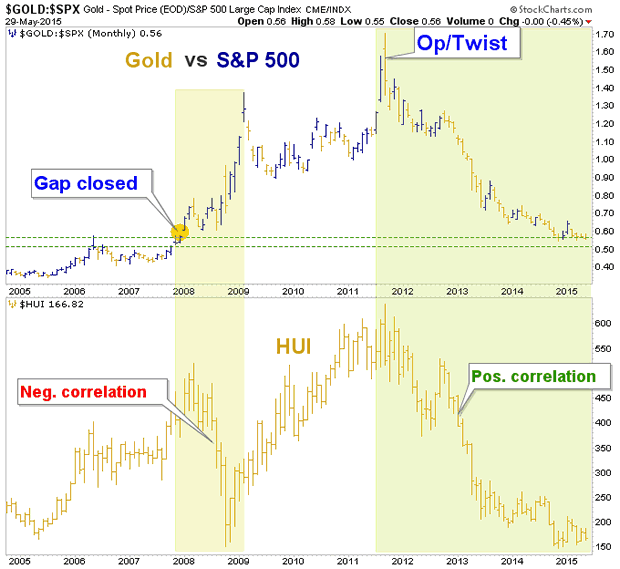
Above we noted that gold vs. the stock market is one macro indicator (among several) to a new bull market in the miners. Here is a chart showing a positive correlation of Gold-SPX and the HUI. NFTRH advised a huge buying opportunity in the gold stock sector in Q4 2008 as HUI crashed while Gold-SPX went impulsively higher. HUI then quadrupled off of that buying opportunity. The current situation is not quite baked yet by this view either. As we have stated all through the bear market, gold should rise vs. broad stocks as a key positive macro fundamental underpinning to the gold stock sector.

This is why we use as many valid indicators as possible to build a case for a given buying opportunity. The results can be staggering. Patience is a key element on this cycle because the process is a slow creep compared to 2008, which was lighting quick and demanded clear focus and immediate action.
The current process is much more like the 1999-2001 process than Q4 2008. But for those who are able to keep perspective all the way through, the result could be just as rewarding as either of those two opportunities.
Meanwhile, we have been taking what the markets give us, identifying opportunities in relatively bullish US sectors like the Semiconductors and risks/opportunities in other US and global markets. All of this with a clear perspective on a big picture that could bring the next big trend trade when cyclical changes come about.
Subscribe to NFTRH Premium for your 25-35 page weekly report, interim updates (including Key ETF charts) and NFTRH+ chart and trade ideas or the free eLetter for an introduction to our work. Or simply keep up to date with plenty of public content at NFTRH.com and Biiwii.com.
By Gary Tanashian
© 2015 Copyright Gary Tanashian - All Rights Reserved
Disclaimer: The above is a matter of opinion provided for general information purposes only and is not intended as investment advice. Information and analysis above are derived from sources and utilising methods believed to be reliable, but we cannot accept responsibility for any losses you may incur as a result of this analysis. Individuals should consult with their personal financial advisors.
Gary Tanashian Archive |
© 2005-2022 http://www.MarketOracle.co.uk - The Market Oracle is a FREE Daily Financial Markets Analysis & Forecasting online publication.


