


Gold Price Has Bottomed – More Evidence
Commodities / Gold and Silver 2015 May 27, 2015 - 04:32 PM GMTBy: DeviantInvestor

 Prominent analysts have announced often and persistently that gold will drop to $1,000, $850, and even below $500. Mainstream media, “gold-bashers,” and banks encourage the “gold is going lower” meme. But gold is real money, in contrast to the paper stuff that is valuable only as long as people, businesses, and countries retain confidence that it will devalue, but only slowly. The world runs on paper and digital fiat currencies so don’t expect banks, central banks, or western governments to encourage or support gold.
However, with the constant barrage of anti-gold, anti-silver, pro-dollar and pro-paper media stories, it is not surprising that people are confused, worried, and scared regarding gold prices, the value of real money, and the inevitable demise of paper currencies.
But what if a simple tool would identify most important lows and highs in gold, silver, and the S&P 500 index? Would that reassure people regarding high-probability turns in those markets and thereby encourage investors to ignore the media propaganda, both for and against, those markets?
THE FINANCIAL STRESS INDEX (my version):
- This indicator is good at finding some bottoms and tops – when markets, governments, investors, and central banks are worried and when sentiment often indicates turns in major markets.
- The Stress Index is not perfect and should be used in conjunction with other fundamental, technical and sentiment analysis.
- This is a long term indicator. It will help very little with next week’s prices.
- It indicates that gold and silver probably bottomed in March of 2015. Price action since then also indicates that March was a likely double-bottom.
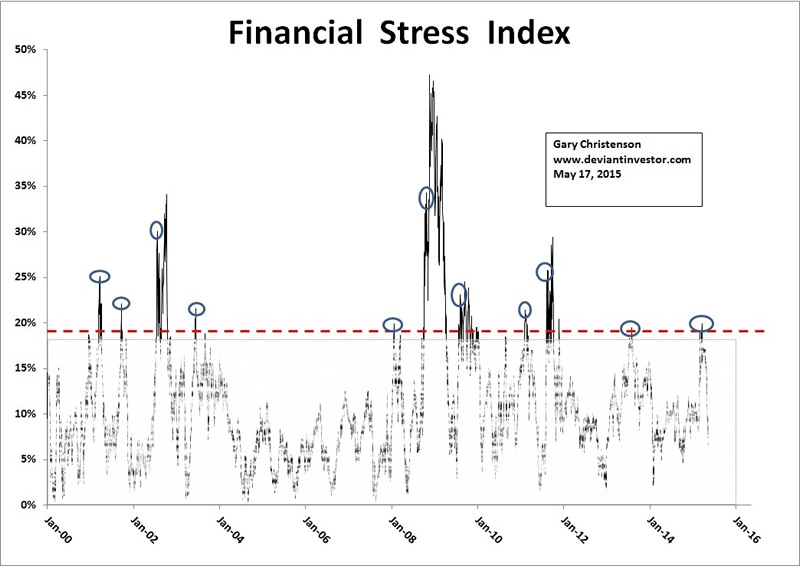
- The stress index (described later) turn points are marked with ovals on the 15 year graph.
- Ignore all data below 19% and pay attention to the spikes above 19%.
- If there are multiple highs in a short period, such as in mid-2002, use the earliest spike high.
- The spikes indicate highs in financial stress which often mark highs in one market, such as the S&P, and simultaneous lows in another market, such as gold.
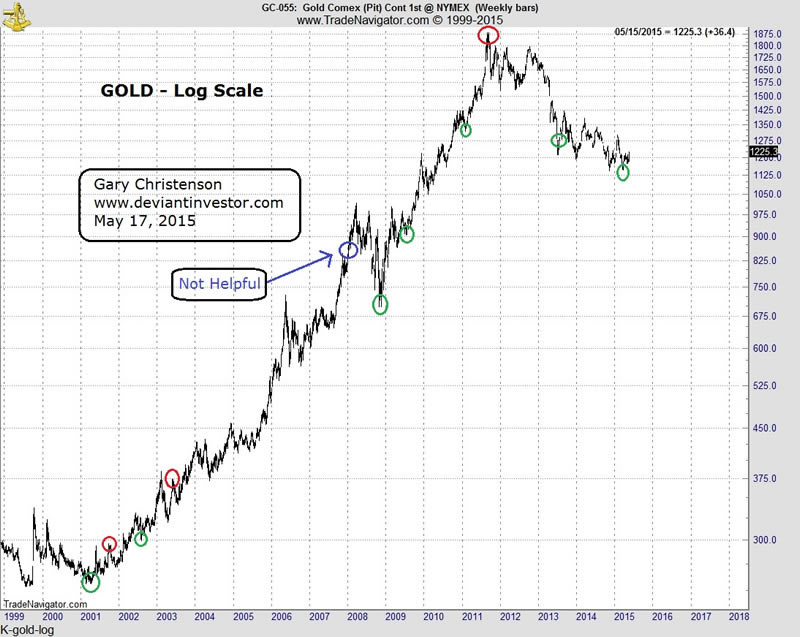
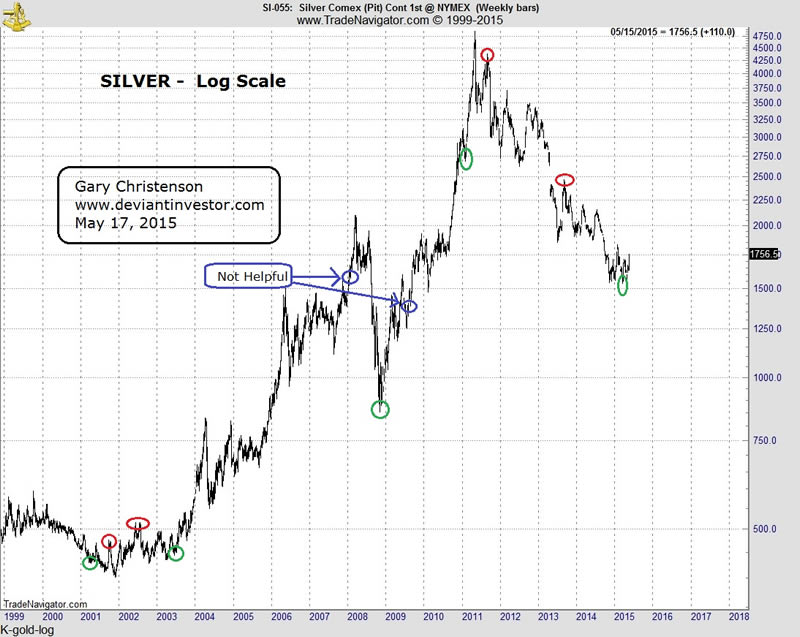
What does the Stress Index say about the gold market? Examine the graph of gold where the highs for the Stress Index are marked on the gold graph. The stress index often marked major turns, such as in early 2001, late 2008, mid-2009, August 2011, and March 2015.
Examine the graph below where the Stress Index highs are marked on the S&P graph. The stress index includes the deviation of the S&P from its 200 day moving average so, unsurprisingly, it often marked the highs and lows in the S&P 500 Index.
The index is simple in concept. How many % above or below their 200 day moving averages are the daily S&P and the daily T-Bond prices? Take the sum of the absolute value (all percentages are counted as positives) of both deviations from their 200 day moving average and graph it, which produces the Stress Index as shown earlier. When the S&P and the Bond market are at extremes (highs or lows) compared to their 200 day moving averages, sentiment is usually intensely positive or negative. That sentiment affects the gold and silver markets and they often turn about the same times. The Stress Index is a simple indication of how far the S&P and Bond markets have been pushed to extremes.
CONCLUSIONS:
- Markets become over-bought and over-sold, or extended to extremes, in both directions. At some point they reverse, as indicated by the Stress Index.
- Intense moves in the S&P and Bond market indicate extremes in sentiment that also affect the gold and silver markets.
- Many gold bottoms and tops have been identified over the past 15 years by this Stress Index.
- The “gold-bashers” may be correct (I doubt it), and the High-Frequency-Traders and central banks may crush gold and silver prices again, but I doubt it.
- The Stress Index indicated a bottom in the gold and silver markets in March of 2015.
Do your own research but don’t ignore sentiment as indicated by the Stress Index.
GE Christenson aka Deviant Investor If you would like to be updated on new blog posts, please subscribe to my RSS Feed or e-mail
© 2015 Copyright Deviant Investor - All Rights Reserved Disclaimer: The above is a matter of opinion provided for general information purposes only and is not intended as investment advice. Information and analysis above are derived from sources and utilising methods believed to be reliable, but we cannot accept responsibility for any losses you may incur as a result of this analysis. Individuals should consult with their personal financial advisors.
Deviant Investor Archive |
© 2005-2022 http://www.MarketOracle.co.uk - The Market Oracle is a FREE Daily Financial Markets Analysis & Forecasting online publication.