


Gold : Truth is Stranger than Fiction
Commodities / Gold and Silver 2015 May 24, 2015 - 11:00 AM GMT

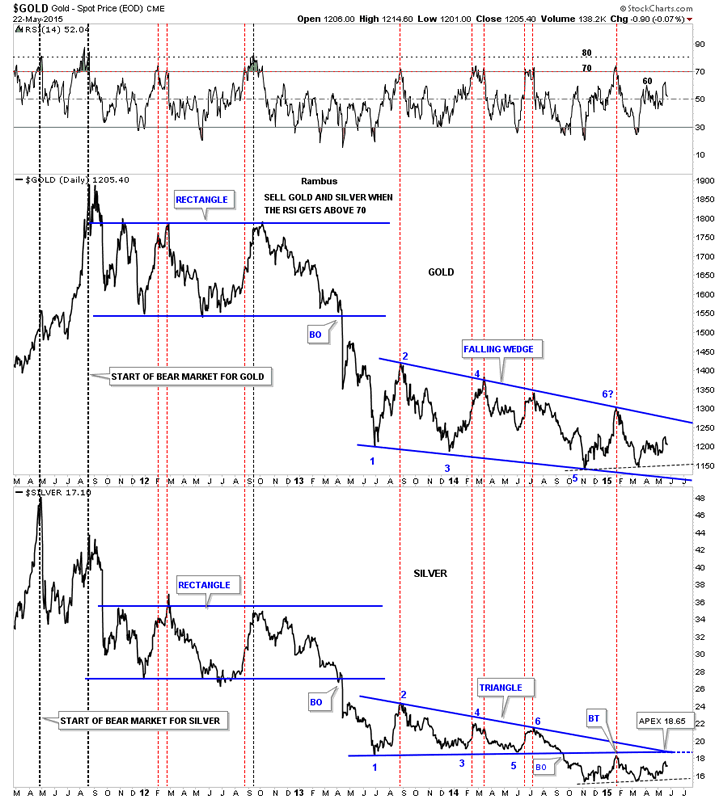
 Below is a combo chart that has gold on top and silver on the bottom. This chart goes back to the bull market top for both gold and silver and the bear market that ensued. Silver topped out in April of 2013 with gold topping out in September of the same year. Their first bear market consolidation patterns were rectangles and both broke down at the same time. From that initial low in June of 2013 they both started to form consolidation patterns and that’s where they parted ways. Silver built out a 15 month 6 point triangle consolidation pattern before it broke down. The bottom rail of the 6 point triangle consolidation pattern has held resistance for nine months or so. The first thing that would get me excited about silver would be if it could take out the apex of the blue triangle above 18.65. Below the apex bearish and above bullish.
As you can see gold is trading almost dead center in the middle of it’s massive 6 point falling wedge. A break of the top rail would be the first thing I would need to see to get bullish on gold.
One last note on this chart below. The vertical dashed lines shows the price action of the two precious metals when the RSI gets over 70. It’s not a perfect gauge but if you see these two trading above their respective RSI above 70 it’s time to watch things very close. If you see the RSI make a double top above 70 get out of Dodge and if you see the RSI get above 80 head for the hills.
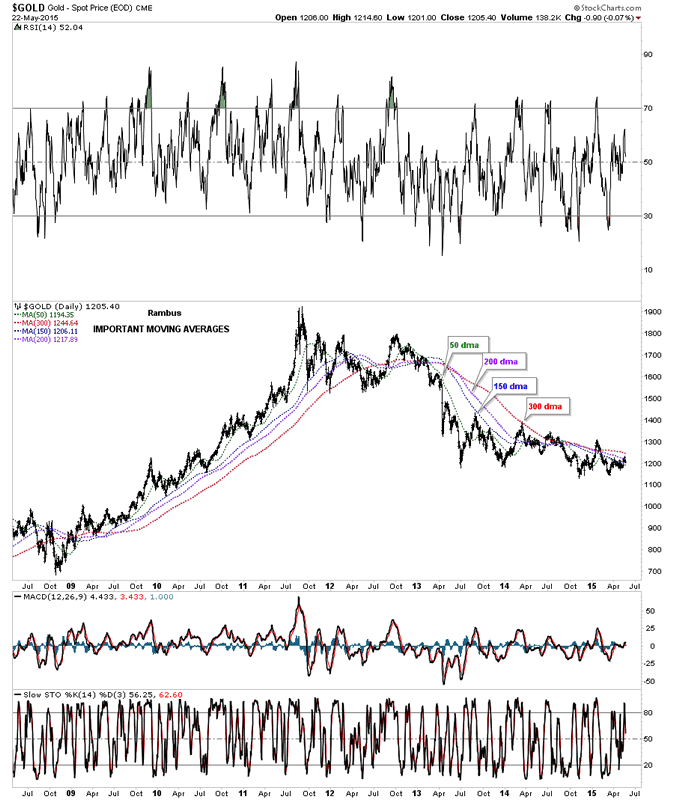
Below is a daily chart that shows gold’s most important moving averages. At one point this week gold traded as high as 1232 closing at 1205. At the high this past week gold was trading above 3 of the 4 moving averages but by the close of trading today it’s only trading above one of the moving averages the 50 dma which comes in at 1194. So all the ground gained during the early part of the week was given back by the end of the week.
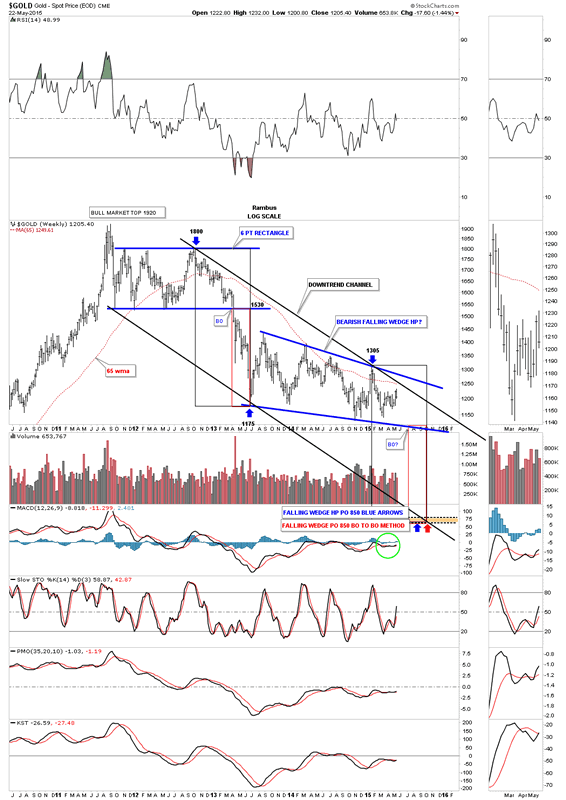
I would like to update you on gold’s downtrend channel we’ve been following for quite some time now. This week gold came within about 17 points of hitting the 65 wma and the top rail of the downtrend channel. A linear scale chart shows gold did indeed hit the top rail. So far everything is on schedule for gold to break the bottom rail in late June or early July. It is what it is until it isn’t.
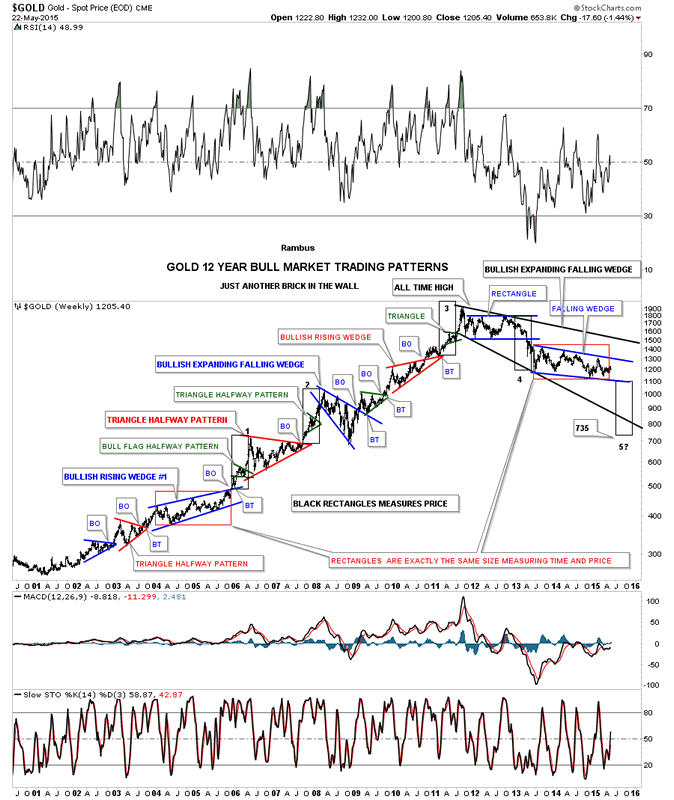
I’ve posted this next weekly chart several times in the past for gold that shows every consolidation pattern that formed during gold’s bull market years right up to the present day. I was looking at this chart today at the different sizes of consolidation patterns that have formed since 2000. There is only one other consolidation pattern, that has taken as long as our current bearish falling wedge to developed, and that was the bullish rising wedge that formed back in 2004 and 2005 labeled #1. I put a red rectangle around the blue bullish rising wedge from 2004 and 2005 to measure the width and height or time and price and added it to our current falling wedge. As you can see they’re almost identical in both time and price.
If you look real close at the blue bullish rising wedge #1 you can see a very clean breakout with an nice clean backtest and then the impulse move up began. Also note the little green triangle that formed in the middle of that impulse move up that ended at the beginning of the red triangle. Perfect Chartology. Just for the hell of it, because both wedges are almost exactly the same in time and price, I measured the impulse move from the breakout point on the blue rising wedge #1 to the top of the red triangle. I took that measurement and added to where the breakout may occur on our current bearish falling wedge to see what the price objective be. It turns out to be about 735 which is the low end of where I would expect the final low to come in.
One last thing about this long term weekly look at gold. Notice the thin black rectangles that are exactly the same size numbered one thru five. They show the height for those individual impulse moves. Will we see a similar sized move down if we ever get the next impulse move going? Sometimes the truth is stranger than fiction. I hope everyone has a great three day weekend. All the best…Rambus
This entry was posted in public by Rambus. Bookmark the permalink.
All the best
Gary (for Rambus Chartology)
FREE TRIAL - http://rambus1.com/?page_id=10
© 2015 Copyright Rambus- All Rights Reserved
Disclaimer: The above is a matter of opinion provided for general information purposes only and is not intended as investment advice. Information and analysis above are derived from sources and utilising methods believed to be reliable, but we cannot accept responsibility for any losses you may incur as a result of this analysis. Individuals should consult with their personal financial advisors.
© 2005-2022 http://www.MarketOracle.co.uk - The Market Oracle is a FREE Daily Financial Markets Analysis & Forecasting online publication.