


$GOLD Price Year 2007 Again
Commodities / Gold and Silver 2015 Apr 23, 2015 - 12:59 PM GMTBy: Ned_W_Schmidt

 Imagine you could go back in time so you could buy some investment at a bargain. Many might also wish to go back in time to sell something. But, let us stick with the idea of returning to an earlier time to buy some asset, like before Gold began its ran to $1,900. Since we know what happened, which of us would not again buy Gold? Well, you are in luck. $Gold is now priced relative to stocks as it was in 2007. To save you time, $Gold closed out that year at about $830.
Ratio $Gold/S&P500 versus $Gold
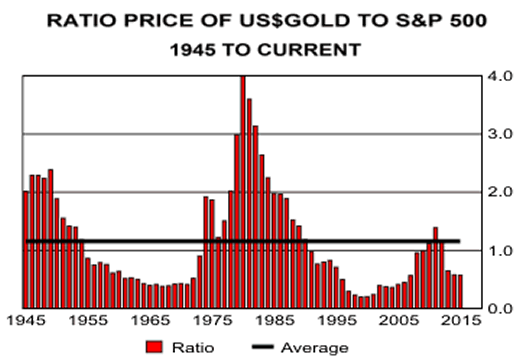
Bars in chart to right are the ratio of year end values for $Gold divided by that for S&P 500, back to 1945. Last bar in chart is for the current value of that ratio. Solid black is line is average of that ratio over the time period shown. High ratio suggests that $Gold is expensive relative to U.S. equities. A low value indicates that $Gold is cheap relative to U.S. equities. This valuation ratio is not a short-term timing tool, but rather can be an indication of when the potential of $Gold to appreciate in the future relative to the S&P 500 is high. As indicated by the smaller black line, the current value of thatratio has not been experienced since 2007. Again, $Gold closed out that year at ~$830.
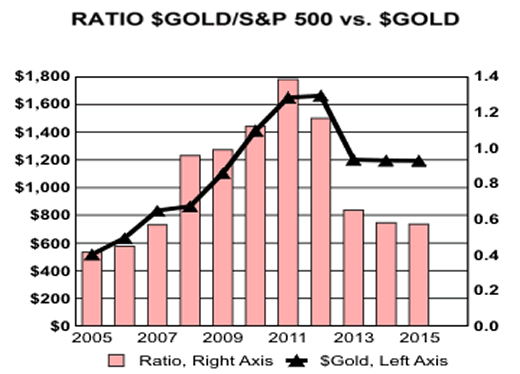
Bottom chart to right portrays the experience of that ratio over past decade. Black line in chart is year end value of $Gold, using left axis, with the most recent data being the last plot. Note that $Gold line has been roughly flat in recent years. While $Gold has experienced ups and downs, it ended 2014 roughly where it did in 2013 and is currently about where it ended 2014. Consider that action with bars for the ratio. As ratio moved to below 0.6, $Gold began to form a multi year "bottom".
Why might that be the case? One possibility is that individuals, who tend to be value oriented, realize that $Gold is cheap given the reckless monetary policies of Western nations and the extreme risks now existing in the geopolitical sphere. Second, the stock mania has been pushed to such an extreme in the U.S. that investors are beginning to recognize the great risk in today's stock prices, and are hedging their portfolios with Gold. A third possibility, and one that should not be casually dismissed, is $Gold is cheap in absolute terms. While that absolute value is difficult to guess, our current long-term value estimate is $1,987.
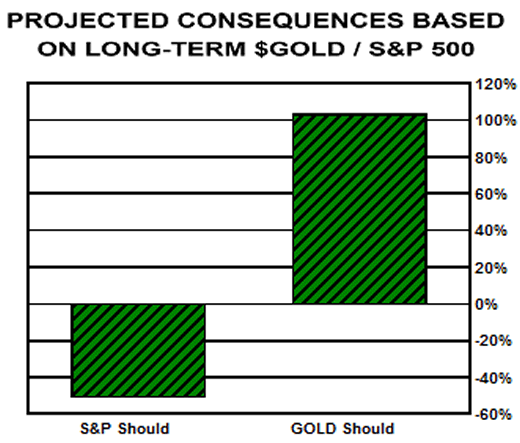
We can use the long-term average of that ratio to say something about the potential for $Gold and the S&P 500. Based on that ratio, if the S&P 500 is correctly priced at 2,100, $Gold should be $2,431, or double the current level. Alternatively, if $Gold is correctly priced at $1,200, the S&P 500 should be 1,035, or roughly half of the current value. The implications of these calculations are portrayed in the chart below. Naturally, reality will likely be somewhere between these values.
Projected Consequences Based on Long-Term $Gold/S&P500
Valuation does not tell us when the price of an asset will rise, only that it should. Under valuation as is the case with $Gold indicates that the price should go up in the future. The ratio discussed above suggested strongly that $Gold should have been bought in 2007 at ~$800. That conclusion remains rewarding. The ratio is again saying $Gold should be bought.
An under valued asset needs a catalyst to correct the mispricing. As we look around the world, many potential possibilities exist to be the "trigger" for higher Gold prices. But, not owning Gold and continuing to play the greater fool game in U.S. equities does not seem wise given the history of both Gold and stock manias.
Ned W. Schmidt,CFA is publisher of The Agri-Food Value View, a monthly exploration of the Agri-Food Super Cycle, and The Value View Gold Report, a monthly analysis of the true alternative currency. To contract Ned or to learn more, use either of these links: www.agrifoodvalueview.com or www.valueviewgoldreport.com
Ned W Schmidt Archive |
© 2005-2022 http://www.MarketOracle.co.uk - The Market Oracle is a FREE Daily Financial Markets Analysis & Forecasting online publication.