What Is Really Driving Gold Price?
Commodities / Gold and Silver 2015 Apr 17, 2015 - 10:24 AM GMTBy: SecularInvestor
 If anything, gold bulls are continuously looking to confirm their bullish outlook. Most precious metals websites are filled with stories, news and developments from the gold market, accompanied by the implication that they will drive the gold price up. Examples of this include gold coin sales, Shanghai gold withdrawals, central bank buying volumes, evidence of market manipulation, money printing volumes, velocity of money, etc.
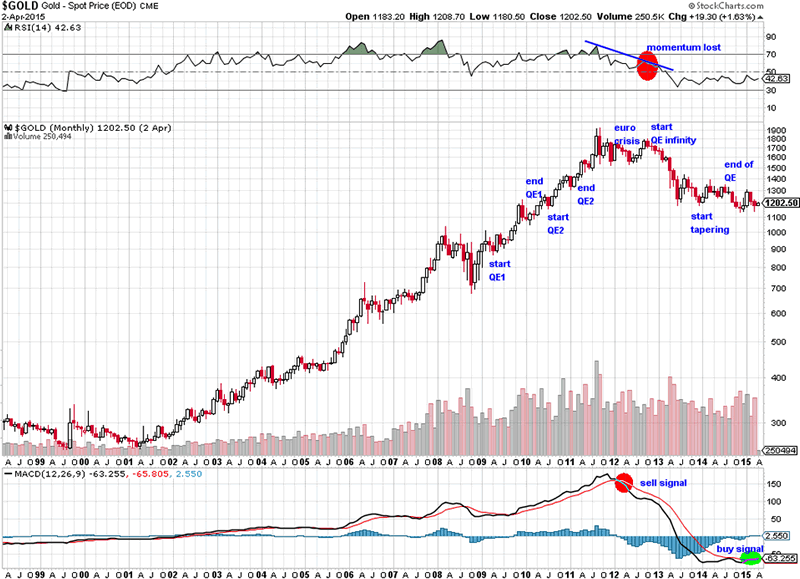
The ongoing narrative is that there is a positive correlation between monetary stimulus and the price of gold. However, as you probably know by now, precious metals collapsed during the Fed’s QE to infinity program. The long-term gold chart (first chart below) shows that gold stabilized when the Fed started tapering and around the end of QE, which is very counterintuitive to say the least. That is not to say there is no correlation, but there is definitely not a direct correlation.
This begs the question: what drives gold and the whole precious metals complex?
Before answering that question, readers should understand gold’s dual role. Fundamentally, it provides protection during times of monetary crisis. That is why a secular investor needs physical gold in its portfolio, especially as the current government debt bubble and global currency crisis unfold. However, this type of protection is only useful in exceptional times.
Next to that, gold is an investment asset. We are aware that the average gold bug does not agree with this, but let’s face it, most of the time we do not find ourselves in extreme circumstances. Gold follows the dynamics of market cycles as well: it goes up until it is (severely) overbought, it goes down until it is (severely) oversold, it consolidates (for a long time), and starts all over again. Admittedly, this is a very simplistic view, but that is essentially what a normal cycle looks like.
What we, as humans, tend to do is associate ‘events’ with market developments, because we need an ‘explanation’ for everything. Similarly, when trends change, we want to be able to explain why that is happening, and associate it with some sort of ‘event’. That is human nature. This has a drawback, however, as it prevents investors from looking at reality. Think about this for a second and try to identify the last time it happened with yourself.
One of the real drivers of investment assets, however, is opportunity and opportunity cost. What does that mean? It means that people prefer assets that are likely to have better yield. Alternatively, if an asset climbs too high and/or too long, the opportunity cost becomes high.
This is true today more than ever before and there is a reason why we are emphasizing this. The point is that all trading decisions nowadays are computer based. More than ever before, small and large investors are using chart and market analyses to make decisions.
On top of that, algorithmic trading is becoming more prevalent. We, just like everyone who is in some way disadvantaged by algo based trading, are no fans of this practice. But let’s face it, algorithms have the same driver as the humans that programmed them: they search the markets in search for maximum yield.
Electronic trading is a factor that should not be underestimated. It is driving markets more than ever before, and the gold market is no exception to that. That is not to say we like it; it is simply the way things are done nowadays.
To make that point, we have added several “events” to the long term gold chart. Note how gold was rising during QE1 and QE2. When the Fed went ‘all-in’ with its QE to infinity program, gold started to collapse. Clearly, there is no one-to-one correlation between the gold price and ‘the creation of money’, which was widely assumed up to that point.

Gold’s uptrend in 2011 had lost so much momentum that alternatives started to look much more interesting. As a consequence, gold’s strong trend started turning and it eventually reversed; just because other alternatives had higher yield expectations.
Gold’s fundamental driver: disinflation
We went one step further and analyzed all market conditions when the big rally in precious metals started in the summer of 2010. The only observation that stood out was the record volume of short positions held by commercial traders in the COMEX gold futures market (not in silver though). Because of that, the short squeeze that followed was phenomenally powerful. COMEX helped fuel the rally, but it is doubtful whether it was the ‘driver’.
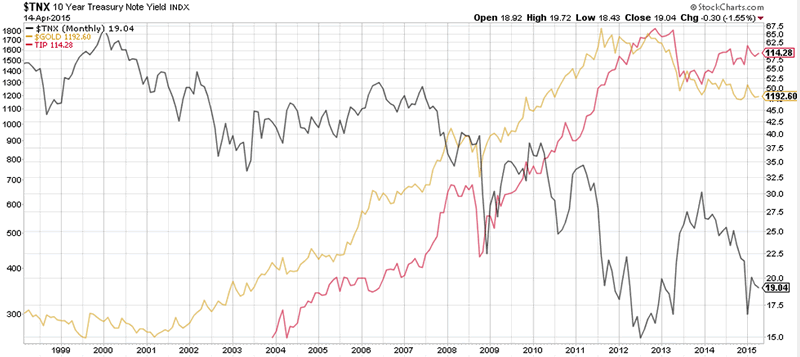
The clearest driver, in our view, has been inflation expectation. The chart below makes that point. The red line, which represents TIPS (inflation-protected US Treasury bonds), an instrument that reflects real yields for maturities ranging from 5 to 30 years, moves almost perfectly in sync with gold. Similarly, we know meanwhile that disinflation (a slowing level of inflation, not deflation though) is gold’s biggest enemy. That is confirmed by the stabilization of TIPS since mid-2013, which has been preventing gold from rising as the chart shows.
Another thing that stands out on the chart below is that gold does not correlate with interest rates (the grey line). There is a strong narrative currently around interest rate hikes and lower gold prices. The problem with that is the underlying assumption that all other conditions apart from interest rates remain the same, in particular the rate of (dis)inflation. For instance, if interest rates go up in an inflationary environment, we should see gold go up. Remember, it is the interest rate in the context of inflation expectations that drives gold.

We can hear you thinking, dear reader, that we are not taking manipulation into account. Manipulation works in both directions, however. When gold was going through one of the strongest and longest bull markets in history, there was also market manipulation. Just like it pushed gold prices higher back then, it has been reinforcing the downtrend since its peak. Consequently, as precious metals have been manipulated lower, there will be a point where the opportunity becomes so attractive that investors will increase their exposure to gold related investments again and we could be very close to that point.
The other argument that one could come up with is that we are not taking physical gold’s supply and demand into account. The fact is these are not price drivers. Why? Demand for gold is truly different than demand for other commodities because the supply of gold is fixed (it only increases by approximately 2% per year). Consequently, higher gold demand means that gold is merely changing hands, without necessarily pushing prices higher.
Gold’s investment driver: opportunity (cost)
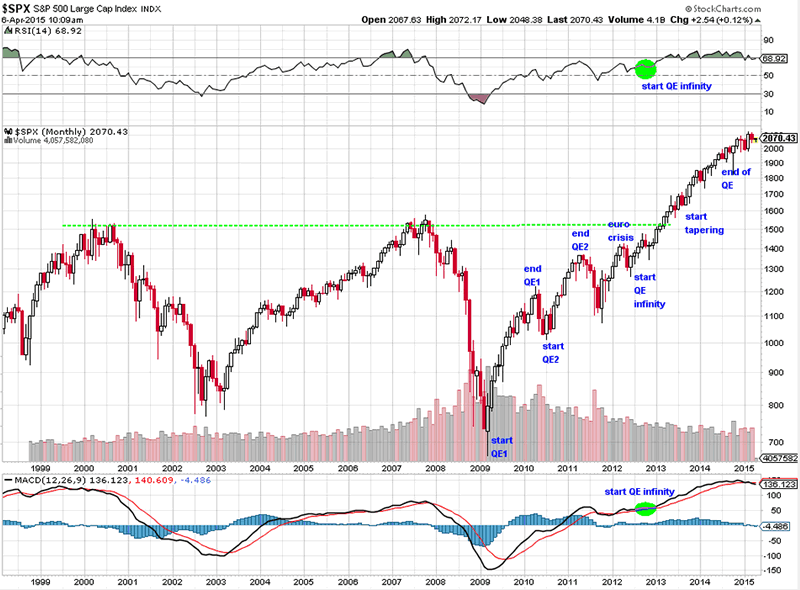
At its all-time high in 2011, gold was severely overbought. There was simply more potential for yield in stocks. The long-term S&P 500 chart (see below) makes that point. The notes indicate that the rise of the stock market is not linked to one type of event, although it is commonly accepted that the creation of money has been fueling it.
Even more interesting, in 2012, when QE to infinity was launched, the chart setup for US stocks looked promising. There were several sell offs in the years before which prevented the overheating of momentum, as indicated by the two green circles. Gold, on the other hand, showed a failed attempt to push through its peak.

However, as time passes and conditions change the opportunity cost to not hold gold-related assets is subject to change as well, and to such an extent that it is turning into an exciting opportunity. Maybe the gold market will attract sufficient interest in one or two years, or in a couple of weeks, we simply do not know in advance. But the key point is the opportunity, and contrarian secular investors have a strategic plan which they are slowly but surely executing as the new trend unfolds.
When gold’s trend changes, everyone will be ready with a ‘reason’ or an ‘explanation’ for the new uptrend. A new narrative will be created. Mark our words. Most investors, however, will enter very late in the new cycle because they are still blinded by the former narrative, the one which says that gold will not go up because of reasons x, y, and z.
Another golden opportunity in the making?
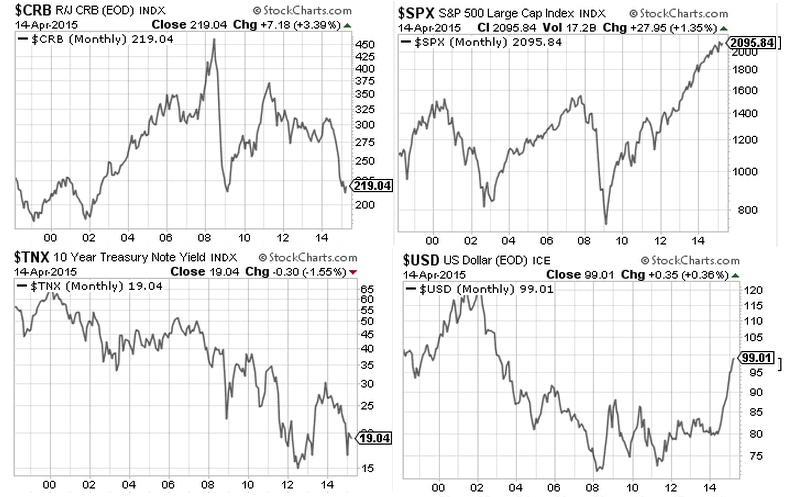
Going forward, what does all this mean for secular investors? We will answer that question based on the chart below as well as the long-term gold and S&P 500 charts above.
First, the S&P chart above looks tired. Momentum is fading, which does not bode well for the short and mid term. Is this the end of the stock bull market? Probably not, but hard to say. Assume a scenario in which stocks would correct and test the breakout point; that would point to a strong secular bull market going forward in US stocks. On the other hand, a break below 1,600 points would be ultra bearish.
Second, gold is building a solid base and there is a technical buying signal, evidenced by the green circle on its long-term chart (first chart above). If the consolidation continues, and gold doest not break below $1,000/oz, the opportunity cost for not holding gold related investments would simply become too high.
Consequently, if inflation picked up in an environment where the opportunity cost of not holding gold rises, gold would most likely continue its secular bull trend in a big way. Do you recognize the two drivers we discussed before?
Likewise, as long as the ongoing disinflationary trend continues, gold rallies will be capped.
Other asset classes, in particular commodities and the dollar, are somewhat mixed. On the one hand, commodities have fully retraced their multi-year rally and the chart does not look good. At the same time it seems that the downside is becoming limited. The dollar has had a strong rally, but keeping this up at the same pace is doubtful because of the exceptional strength of its recent rally, as we explained last month.

So could we conclude that gold has an attractive outlook and that opportunity cost is rising? Being secular investors, we think so, but we would like to see more evidence.
What we would like to see, ideally, is an indication of rising inflation, which could come in the form of an uptake in economic activity; that would stop the ongoing disinflationary trend. However, there is another form of inflation. If interest rates rise, bond prices would fall. As the bond market is huge compared to other markets, it means that a significant part of those dollars and/or euros will flow to other assets. Because of that, the price sof stocks and commodities, including gold, should inflate.
And there you have our contrarian call. We at SecularInvestor.com are sensing that higher interest rates could become the next trigger to push precious metals higher in the years ahead.
Obviously this is a statement that goes against the ongoing narrative and consequently it is not in the minds of most investors. Why? Because almost everyone believes that gold can only go lower, that interest rates can only go lower, and that there is a one-to-one correlation between interest rates and gold. This has been fueled day after day by mainstream media, as usual.
In a world where people dream up opportunity costs every week, basically chasing a new guru or tool, following a secular trend is the easiest and most powerful way to advance your financial position. That does not mean you should invest in any gold stock you can find, however. Secular Investor follows the best miners across the world and gives you concrete investment tips through our monthly Gold & Silver Report, special Q&A reports with CEOs, and attending every mining conference that matters! Subscribe now that prices are still low!
© 2015 Copyright Secular Investor - All Rights Reserved
Disclaimer: This article contains the ideas and opinions of the author. It is a conceptual exploration of financial and general economic principles. As with any financial discussion of the future, there cannot be any absolute certainty. What this article does not contain is specific investment, legal, tax or any other form of professional advice. If specific advice is needed, it should be sought from an appropriate professional. Any liability, responsibility or warranty for the results of the application of principles contained in the article, website, readings, videos, DVDs, books and related materials, either directly or indirectly, are expressly disclaimed by the author.
© 2005-2022 http://www.MarketOracle.co.uk - The Market Oracle is a FREE Daily Financial Markets Analysis & Forecasting online publication.


