Inflationary Demand Destruction Delusion
Economics / Inflation Jun 10, 2008 - 12:16 PM GMTBy: Captain_Hook

 Demand destruction refers to the effect of a rising price on a good, service, or commodity, where a rising price has the increasing effect of curbing demand. Central planners live under the assumption the above condition set applies to commodities within current circumstances, which we categorize as quasi-hyperinflationary times at present. Here, the understanding is monetization efforts aside for definitional purposes; along with recognizing True Money Supply (TMS) growth rates have been contracting in the States, and nowhere near what could be even be considered high levels, the theory is lags associated with accelerated gains witnessed previously are still working through the system sufficiently to export reactionary inflation in emerging markets that reside on the very cusp of potential hyperinflationary conditions.
The following is an excerpt from commentary that originally appeared at Treasure Chests for the benefit of subscribers.
And it is this inflation, along with the growth in emerging market economies, which is increasing demand for commodities, and in turn fuelling acceleration in higher prices.
Of course if one were to get sticky about the whole thing, meaning monetizations were included in the ‘big picture', the total money supply growth could perhaps be better characterized (but not formally defined) by adding the totality of methods of inflation, which are varied, incalculable, and hidden from view. (i.e. and truly reflected only in rising prices themselves.) Moreover, it's no fluke things have progressed to this point (hidden and unaccounted for inflation) with a bureaucracy busting at the seams to protect. What Western central planners and Orwellian types fail to realize however is that no matter how much they attempt to hide the effects of inflation, the truth will be reflected in prices eventually, and to the point their (supposed) wish comes true – demand destruction will take place.
So, be careful what you wish for, as the rule of unintended consequences has a tendency to rear its ugly head under such conditions.
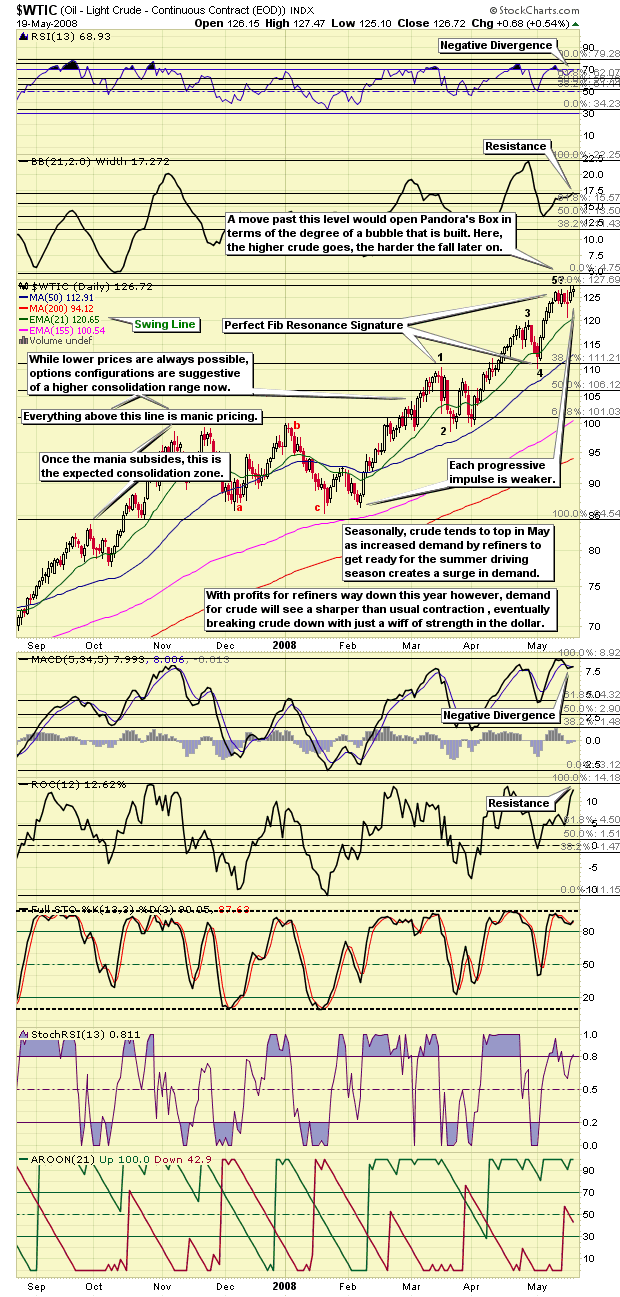
Moving further into this understanding, although the terms bubble and mania are not mutually exclusive when it comes to describing excited market conditions, and although the essential nature of oil (the most essential commodity) makes talk of it being in a bubble inappropriate, with speculation so high at present, at the same time it must be recognized the crude market does qualify as a mania. Combine this with bearish technicals , and we have a recipe for a correction once small speculators (see yellow bars ) have been squeezed out of the market. As you can see in the attached COT Report this is not the case yet, but based on the technical picture that will be presented for you below, we are likely close to a cyclical correction in crude oil prices barring a war breaking out in the Middle East . (See Figure 1)
Figure 1

All this considered, it should be noted rising crude oil is a ‘moot point' with respect to the larger inflation (broad price increases) picture moving forward, where the lagged effect of rising energy prices are still working through other commodity groups in pipeline-pricing pressure. This is of course the perspective behind a rationalization for higher precious metals prices moving forward. Here, the thought process is not only is a sleepy population being awakened to the effects of inflation, which should increase investment demand at the retail level, with the screws continuing to turn in the credit crisis, educated observers know that money supply (no matter how its measured) will need to be ramped up for real, inferring the effects of this in future pricing will need be discounted. And this should bring the institutions into the game. More on this later.
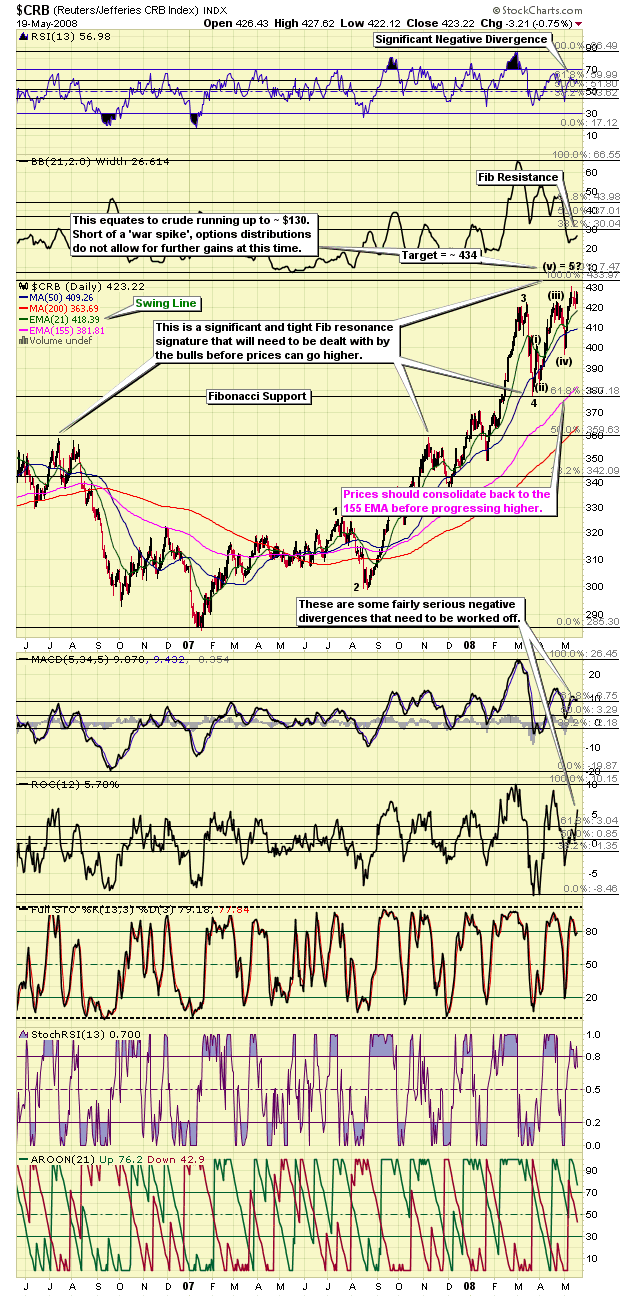
But first, we need to finish up with our explanation of what is currently happening in the larger commodities complex, along with what to expect in the future. Below you will find a chart of the Reuters / Jefferies CRB Index (CRB) , where as you can see in the attached, energies have the highest weighting compared to other groups. You might find it interesting to know this relatively new weighting configuration is a product of price managers thinking energy prices had topped out in 1995, and that by skewing a higher energy component into the widely followed measure, more simply known as the CRB, a continued disinflation picture would be the result. And for a brief period they were correct, with the stock market loving it.
Not long after these changes however, and in looking at current circumstances, the strong fundamentals behind rising crude prices reasserted themselves, producing the high prices we see today that are definitely creating demand destruction. And perhaps if energy prices were not subsidized in China , a great deal more demand destruction would also likely occur there too; but for the moment, we will assume the status quo will be maintained, and that demand from Asia at large will remain firm moving forward. The idea here is that even though a cyclical correction in crude may be in store for us, as suggested by the very tight Fibonacci resonance related target only a few percentage points away now, the combination of continued firm demand and peak oil related depletion would cause further nominal price gains on a secular basis. (See Figure 2)
Figure 2

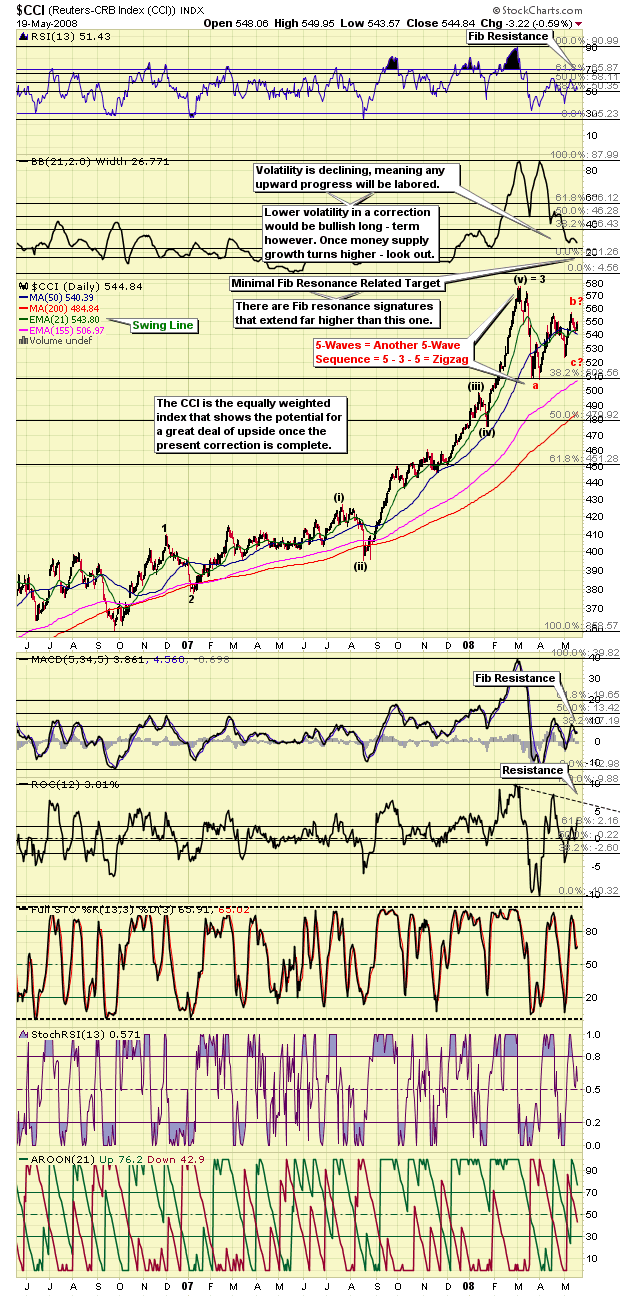
You may remember the larger understanding behind further price gains in crude past this incorporates the assumption monetary debasement rates will accelerate as Western economies continue to contract with credit, and that this inflation will necessarily find its way back into pricing eventually. Further to this, and a thought process that is actually confirmed in the chart of the Reuters Continuous Commodities Index (CCI) , which is the old CRB in terms of weightings (an equal weighting of 17 components), one can see that once a correction back down to Fibonacci related support (in completing an A – B – C) is complete, technicals suggest further gains on a secular basis, with the minimum measure in this regard featured below. (See Figure 3)
Figure 3

Again then, the idea here is that even though crude oil (and larger energy complex) might be making an important intermediate degree top soon (which will cause temporary downward pressure on the larger commodities complex temporarily), the message found in the unspent bullish disposition of the CCI is that pipeline inflation is still working its way through the greater group, working to keep a firm tone in pricing well into the future. So you see the CRB is a better indication of past inflation and true purchasing power deterioration with energies dominating the weightings, while the CCI is a better indication of the inflation and price increases to come. And based on the combined message of the two, while prices may retreat near-term, longer-term they are poised to keep rising on an increasingly broad basis amongst the commodities universe.
Unfortunately we cannot carry on past this point, as the remainder of this analysis is reserved for our subscribers. Of course if the above is the kind of analysis you are looking for this is easily remedied by visiting our newly improved web site to discover more about how our service can help you in not only this regard, but also in achieving your financial goals. For your information, our newly reconstructed site includes such improvements as automated subscriptions, improvements to trend identifying / professionally annotated charts , to the more detailed quote pages exclusively designed for independent investors who like to stay on top of things. Here, in addition to improving our advisory service, our aim is to also provide a resource center, one where you have access to well presented ‘key' information concerning the markets we cover.
On top of this, and in relation to identifying value based opportunities in the energy, base metals, and precious metals sectors, all of which should benefit handsomely as increasing numbers of investors recognize their present investments are not keeping pace with actual inflation, we are currently covering 69 stocks (and growing) within our portfolios . This is yet another good reason to drop by and check us out.
And if you have any questions, comments, or criticisms regarding the above, please feel free to drop us a line . We very much enjoy hearing from you on these matters.
Good investing in 2008 all.
By Captain Hook
http://www.treasurechestsinfo.com/
Treasure Chests is a market timing service specializing in value-based position trading in the precious metals and equity markets with an orientation geared to identifying intermediate-term swing trading opportunities. Specific opportunities are identified utilizing a combination of fundamental, technical, and inter-market analysis. This style of investing has proven very successful for wealthy and sophisticated investors, as it reduces risk and enhances returns when the methodology is applied effectively. Those interested in discovering more about how the strategies described above can enhance your wealth should visit our web site at Treasure Chests
Disclaimer: The above is a matter of opinion and is not intended as investment advice. Information and analysis above are derived from sources and utilizing methods believed reliable, but we cannot accept responsibility for any trading losses you may incur as a result of this analysis. Comments within the text should not be construed as specific recommendations to buy or sell securities. Individuals should consult with their broker and personal financial advisors before engaging in any trading activities, as we are not registered brokers or advisors. Certain statements included herein may constitute "forward-looking statements" with the meaning of certain securities legislative measures. Such forward-looking statements involve known and unknown risks, uncertainties and other factors that may cause the actual results, performance or achievements of the above mentioned companies, and / or industry results, to be materially different from any future results, performance or achievements expressed or implied by such forward-looking statements. Do your own due diligence.
Copyright © 2008 treasurechests.info Inc. All rights reserved.
Unless otherwise indicated, all materials on these pages are copyrighted by treasurechests.info Inc. No part of these pages, either text or image may be used for any purpose other than personal use. Therefore, reproduction, modification, storage in a retrieval system or retransmission, in any form or by any means, electronic, mechanical or otherwise, for reasons other than personal use, is strictly prohibited without prior written permission.
Captain Hook Archive |
© 2005-2022 http://www.MarketOracle.co.uk - The Market Oracle is a FREE Daily Financial Markets Analysis & Forecasting online publication.


