Gold And Silver Nothing Of Substance Going On. Fiat “Dollar” Controlling?
Commodities / Gold and Silver 2015 Apr 11, 2015 - 12:14 PM GMTBy: Michael_Noonan
 There is little going on in the precious metals markets that indicates directional movement to the upside, and not even much to the downside. The news is as disjointed but permeated with sameness as ever before. To try to make sense of nonsense remains in the theater of the absurd. All we have to offer are the current read of charts, and they are an extension of what they have been like for the last several weeks.
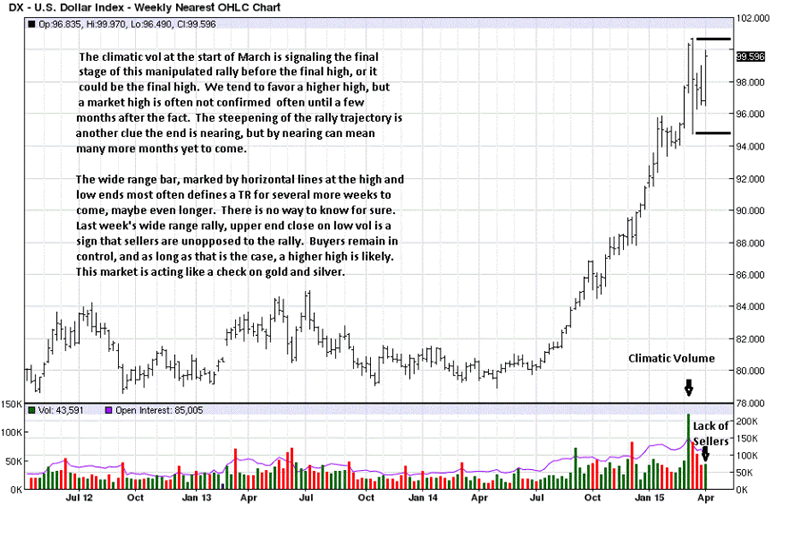
A look at the fiat faux “dollar” chart, the antithesis of gold, may offer the best clue as to why PMs remain mired in the trading range reaches within their protracted down trends.
We have mentioned how the IMF’s SDR basket of currencies will include the Chinese Yuan, to be vote on in October and become effective 1 January 2016. [See Most Widely Used Currency In Western World? Stupidity. 3rd paragraph above first chart.]
If that is to be the case, expect more meandering, maybe with increased volatility, but nothing to be resolved much before the 4th Qtr of this year or into the 1st Qtr of 2016.
The strength of the fiat Federal Reserve Note is a function of the corporate federal US government exercising its military might, and indiscriminately, we might add. While China and Russia, and the BRICS alliance nations are busy building new infrastructures and developing new trade relations, Obomba and company are busy destroying as much of the rest of the world as possible.
For as long as the fast fading, but still very lethal, US military dominance exists, a renewed bull market in PMs cannot. It is really that simple. The US, as emperor may not be wearing any clothes, but it still wields the mightiest sword. Sadly, the worst may be yet to come as the US refuses to bow out gracefully to the will of the rest of the world seeking only harmony and growth.
As an aside, with Russia’s military capabilities, the US may no longer be the mightiest, but it does remain the world’s military bully.
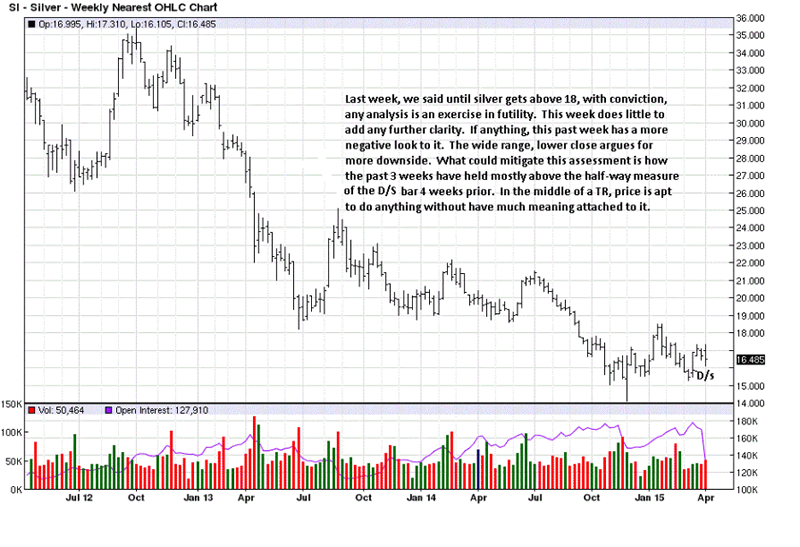
The small range low at the beginning of March, [5th bar from right], and the D/S bar following it [Demand over Supply], remains as a possible retest of the spike low from
November 2014.
Is the final low in for PMs? No one can say with any degree of certainty, and those who have said as much over the past year[s] have been wrong. It is interesting to note how a few more so-called experts are now saying there could be still lower prices. Apparently, they are laboring under the stopped-watch-is-right-twice-a-day theory.
A final low often cannot be confirmed for several weeks, sometimes months after the fact. It really does not matter, a fact more people should embrace. More money is lost from trying to pick tops and bottoms that at any other time in a chart cycle. There is a whole lot of money to be made in the portion of the market above 20% – 25% of the final low, and below 20% – 25 % of the final high. In both instances, there is market momentum behind one’s decision-making.
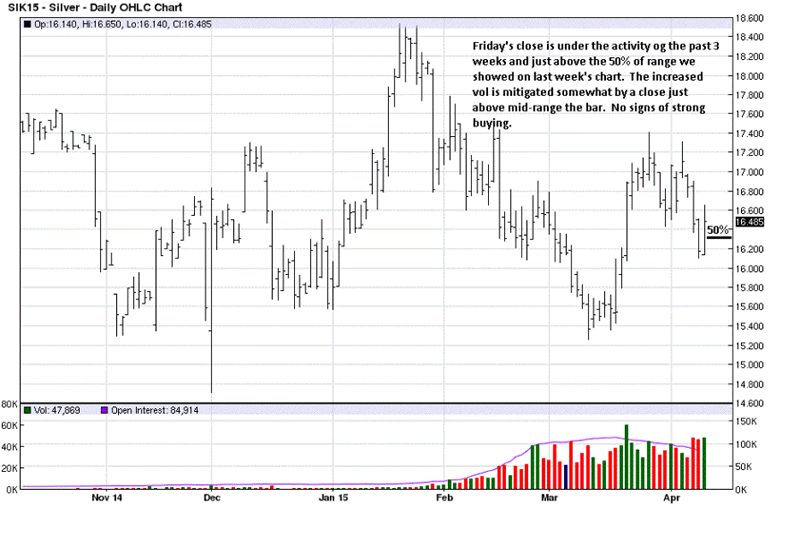
Daily silver is in the middle of a TR, and that is where the LOK is at its least. [Level Of Knowledge]. We choose not to push on a string in any market.
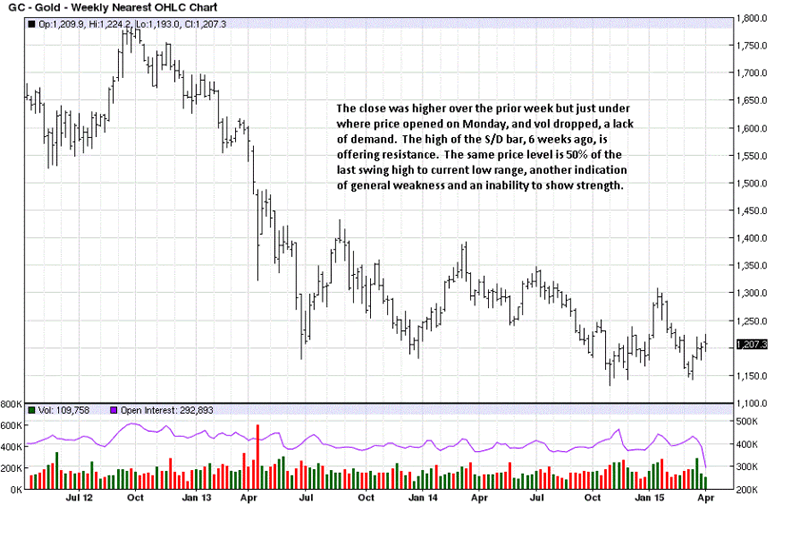
The correlation between the fiat Federal Reserve Note and gold is not a one-to-one situation. While the “dollar” index rallies, gold remains trapped in the lower reaches of its TR. Caveat emptor for the derivative-driven paper market. Keep buying the physical.
As we mentioned in last week’s silver chart, trend changes begin in the smaller time frames. While the weekly and monthly charts do not indicate a change, nor does the daily, for that matter, changes in trend will show up here, first. The chart comments more fully address this fact.
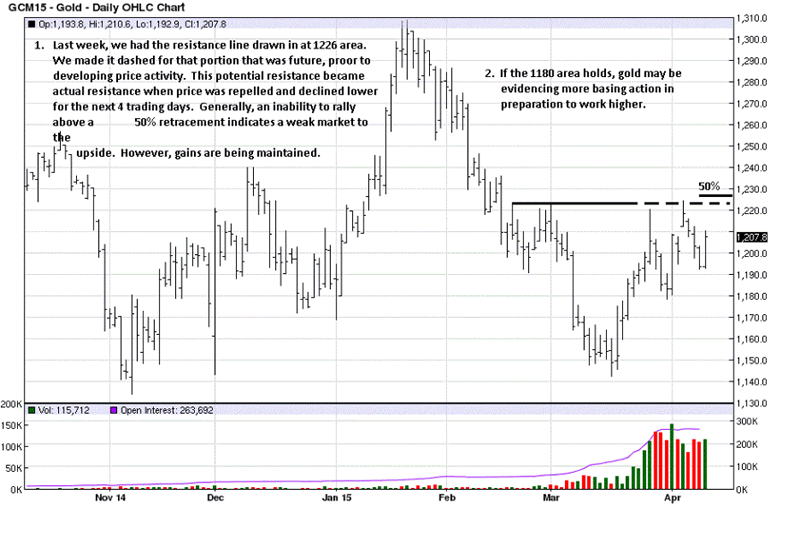
Last week’s gold chart had the resistance line drawn in, as seen below, and the rally came to a halt right at that level. No change and no indication of buying has proven to alter the course of the entrenched down trend.
By Michael Noonan
Michael Noonan, mn@edgetraderplus.com, is a Chicago-based trader with over 30 years in the business. His sole approach to analysis is derived from developing market pattern behavior, found in the form of Price, Volume, and Time, and it is generated from the best source possible, the market itself.
© 2015 Copyright Michael Noonan - All Rights Reserved Disclaimer: The above is a matter of opinion provided for general information purposes only and is not intended as investment advice. Information and analysis above are derived from sources and utilising methods believed to be reliable, but we cannot accept responsibility for any losses you may incur as a result of this analysis. Individuals should consult with their personal financial advisors.
Michael Noonan Archive |
© 2005-2022 http://www.MarketOracle.co.uk - The Market Oracle is a FREE Daily Financial Markets Analysis & Forecasting online publication.


