Gold Price Set To Plunge Below $600
Commodities / Gold and Silver 2015 Mar 05, 2015 - 11:49 AM GMTBy: Austin_Galt
 This analysis covers the long term charts of gold, gold mining shares represented by the HUI Gold Bugs Index and the world’s largest gold producer, Goldcorp.
Let’s commence with the gold price.
GOLD
Gold has been trading as expected in recent times but there has been something in the back of my mind that has been niggling me. That is the long term chart. While I have been feeling in rhythm with gold for quite some time now, I have kept the focus on the shorter term picture. However, now it is time to confront the issue.
Let’s get straight to it with the yearly chart.
GOLD YEARLY CHART
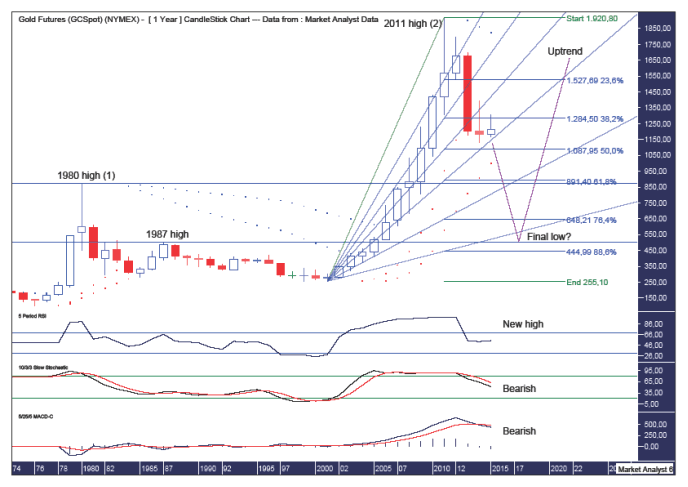
In previous analysis, I drew a Voodoo candle which called for a spike down to below US$1000 before a big reversal higher which closed out 2015 near its highs. This was assuming the 2014 candle would be a slightly positive candle. Well, my timing has been a little off and the 2014 candle turned out slightly bearish.
I can be quite finicky with how I like the picture to look and this change in “look” has been the thing that has been bothering me. However, I have turned a blind eye to it as I focused solely on the shorter term picture. Not anymore.
Let’s cover the lower indicators first.
The Relative Strength Indicator (RSI) set a new high reading at the 2011 price high. This leads me to believe that the ultimate top is yet to be seen. I would like to see a bearish divergence set up which would require a new price high accompanied by a lower RSI reading.
The RSI is trending down but it is still in positive territory so it would not surprise this indicator if price turned back up soon and went to new all time highs. Something to keep in mind.
The Stochastic indicator is trending down and looking bearish. Once again, it wouldn’t surprise to see this indicator turn back up but it is bearish until it’s bullish.
The Moving Average Convergence Divergence (MACD) indicator has made a recent bearish crossover so the likelihood is for lower prices.
So, the lower indicators all appear fairly bearish and that is the bias we must have going forward until there are clear signals to think differently.
There looks to be a massive “three strikes and you’re out” top formation in play with the 1980 high the first strike and the 2011 high the third strike. So I definitely do not think the massive bull market is finished.
I have added the trusty Parabolic Stop and Reverse (PSAR) indicator. There are two sets of dots which pertain to a tight setting PSAR and a loose setting PSAR. Price has already busted the tight setting support so the sirens have gone off on my early warning system. The probability now is for price to eventually go on and bust the dots of the loose setting support. These dots stand at US$1000.
And herein lies my dilemma. I was looking for a move to sub US$1000 as I view that as an important psychological barrier that needs to be cracked. However, price cracking this barrier means cracking important PSAR support which would increase greatly the odds of lower prices.
Perhaps price pulls up above the loose PSAR support and the next bull trend begins from there. Perhaps, but I don’t favour that scenario. I’m going with the probability play which is the busting of tight setting PSAR support being a true early indication of the loose setting support inevitably being taken out.
So how low do I expect the gold price to trade?
I have drawn a Fibonacci Fan with price currently just above the 61.8% angle. There has been some support here and I expect the next 76.4% angle to also provide support. However, I think the final low will be somewhere down near the 88.6% angle.
I have added Fibonacci retracement levels of the move up from 2001 low at US$255 to the all time high in 2011 at US$1920. Previously, I used the 2008 level as the starting point. That was probably due to my bullish fundamental mindset not thinking a move to below the 2008 lows was possible. Well, I should know better. Anything and everything is possible in the markets!
Old highs often provide support in the future and I expect the 1980 high at US$873 to provide temporary support. However, I suspect the 1987 high at US$502 will be closer to the mark for final low.
Now I have been a massive fundamental gold bull all the way down from the high and I will continue to be so all the way down to the final low. Nothing changes there for me. However, my technical view always trumps my fundamental view and I remain a technical gold bear.
I am now looking for a low at the 76.4% level which stands at US$648 and possibly a touch lower. I doubt price will trade as low as the 88.6% level at US$444.
What about the 50% of the all time high price level? Yes, I will still be looking closely at the price action around that US$960 level but a final low there is now not my expectation.
Also, the famed Jim Rogers, who freely admits he’s not a good trader, has recently come out saying he expects a move back to the 50% level. Whoa! Hold the phone!! So Jim, who openly admits he’s not a good trader, is now entering the trading arena calling for a low around the 50% level. Well, byjingoes! That 50% level is already getting too much attention so I believe it is suspect and the gold price will ultimately fall much lower. While I’m with Jim on the fundamentals, I’ll go my own way on the technicals.
NYSE ARCA GOLD BUGS INDEX (HUI)
The NYSE Arca Gold BUGS Index (HUI) is an index of gold mining companies with the BUGS standing for Basket of Unhedged Gold Stocks and is listed on the American Stock Exchange (AMEX). Price last traded at $180.21.
We’ll start with the monthly chart.
HUI MONTHLY CHART
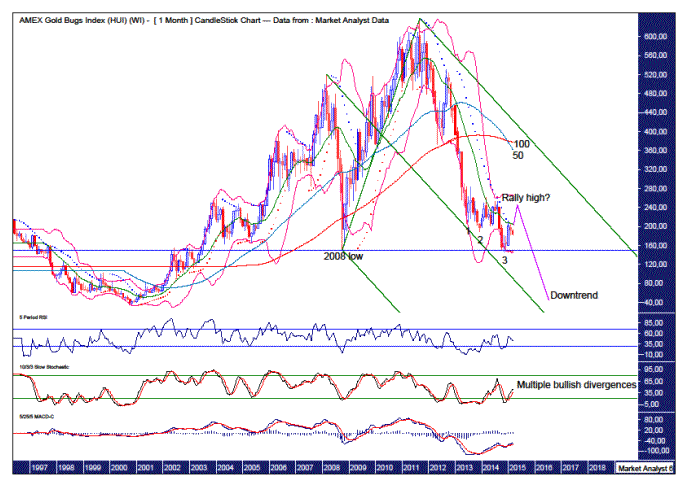
There is a “three strikes and you’re out” low formation in place denoted by the numbers 1, 2 and 3. This normally leads to a significant rise in price and I expect this rally is still playing out.
The most recent low was accompanied by multiple bullish divergences in the lower indicators being the RSI, Stochastic and MACD. This generally leads to a more substantial rally than we have witnessed so far.
The Parabolic Stop and Reverse (PSAR), indicator has a bullish bias after price busted the dots on the upside back in January.
The Bollinger Bands show price is now just below the middle band and I would like to see the final rally high come in around the upper band.
In a bearish development, the 100 period moving average (red) has just made a bearish crossover of the 50 period moving average (blue). Yet more bearish forces at work.
I have drawn a horizontal line which denotes the 2008 low at $150.56. The recent low at $146 sets up a double bottom and considering double bottoms generally don’t end trends, price should eventually come back down and bust below this level.
Also, I have drawn an Andrew’s Pitchfork which shows price trending down within the upper channel. Price looks to be finding support at the middle channel line and I suspect the final low, whenever that is, will be at this support line.
So where do I expect the final low to be?
Let’s go to the big picture yearly chart in an attempt to answer that.
HUI YEARLY CHART
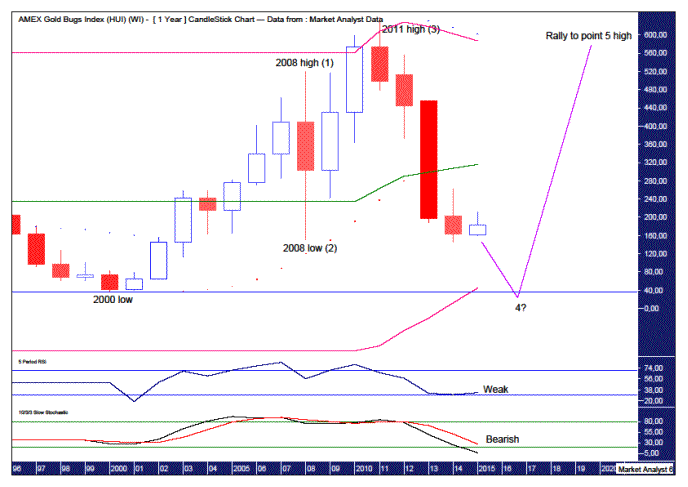
The RSI is in weak territory while the Stochastic indicator is trending down and looking bearish with no sign of turning back up yet. There is not a lot to be pleased about here if you are a bull.
The Parabolic Stop and Reverse (PSAR) indicator has a bearish bias with the dots above bias so the coast is clear on the downside, so to speak.
To my eye, it looks like a massive 5 point broadening top is in play with the 2008 high point 1, the 2008 low point 2 and the 2011 high point 3. That means price is currently making its way to a point 4 low after which price launches higher to new all time highs and eventually puts in a point 5 high.
So where is the point 4 low likely to be?
I have added Bollinger Bands which show the middle band has failed to provide support for price. Therefore, I believe the final low will be around the lower band and perhaps trade a bit below just as the 2011 high traded a bit above the upper band.
In previous analysis, I used Fibonacci retracement levels using the 2000 low at $35.31 as the starting point. I am now having second thoughts about this believing the assumption that new record lows weren’t possible being too presumptive.
I suspect price can nudge marginally below the 2000 low and that is where the final low will be. Of course I will still be watching how price behaves before that, especially around the 88.6% Fibonacci level which stands at $104.08 but it is now my stance that the final low will make marginally record lows.
And as always, it is just my opinion!
Let’s finish up by analysing the gold behemoth, Goldcorp.
GOLDCORP (GG)
Goldcorp Inc (GG) is a low cost gold producer with operations and development projects located throughout the Americas. It is the Big Daddy of the gold world and is listed on the New York Stock Exchange (NYSE) with a market capitalisation of around $17billion. Price last traded at $20.51.
Let’s begin with the yearly chart.
GG YEARLY CHART
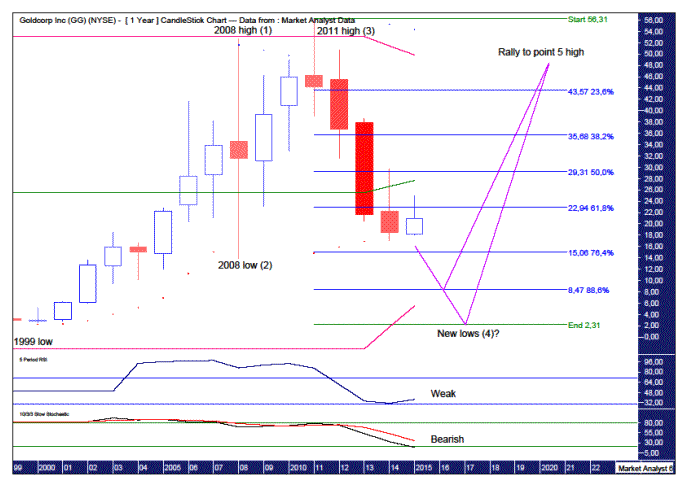
The Relative Strength Indicator (RSI) is looking weak while the Stochastic indicator is trending down bearishly. Nothing for the bulls to get excited about here.
The Parabolic Stop and Reverse (PSAR) indicator has a bearish bias after price busted the dots on the downside last year.
There looks to be a massive 5 point broadening top in play with the 2008 top point 1, the 2008 low point 2 and the 2011 high point 3. That means price is now headed for the point 4 low.
Where is the final low likely to be?
I have added Fibonacci retracement levels of the move up from 1999 low at $2.31 to the 2011 high at $56.31. I struggle to believe price will get so smashed that new lows are made but it must be given consideration. For now, I am looking for price to make a low around the 88.6% level which stands at $8.47.
And once the low is in place, wherever that may be, price should then launch to all time highs as it searches for a point 5 high.
Let’s move on to the monthly chart.
GG MONTHLY CHART
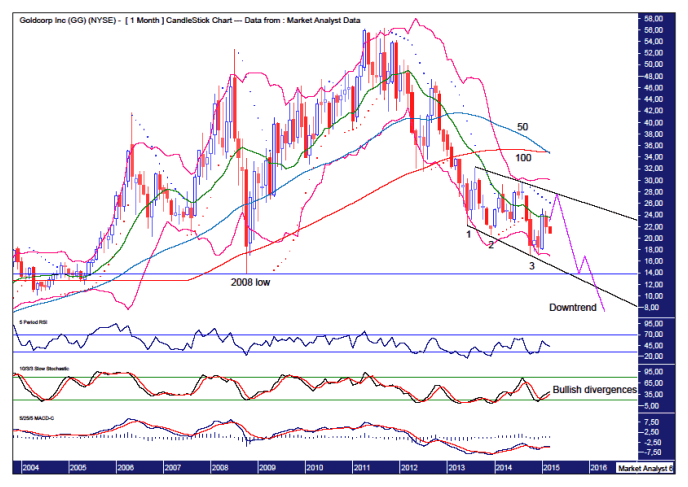
There is a “three strikes and you’re out” low formation in place which is denoted by the number 1, 2 and 3.
The lower indicators, the RSI, Stochastic and Moving Average Convergence Divergence (MACD), are all showing multiple bullish divergences at this recent low and I expect a more substantial rally than we have so far seen in response to that.
The PSAR indicator has a bearish bias with the dots over price but I suspect a pattern of dots being busted every which way is occurring which is an indication of corrective price behaviour. The dots are currently at $26.18 and I expect price to take them out.
I have drawn two trend lines which form a downtrend channel and I am looking for the final rally high to be at resistance given from the top of the channel.
I have added moving averages with time periods of 50 (blue) and 100 (red) and we can see they are just now making a bearish crossover. And this is the monthly chart so it is a solid indication of a downtrend in progress.
After the coming rally high I expect price to get crunched and fall to new lows. There will probably be a reaction off the 2008 low level which stands at $13.84 and is denoted by the horizontal line. After a brief reaction higher, price should then break down below the lower trend line as the downtrend gains momentum.
Disclosure – I have no financial interest in GG.
SUMMARY
Finally, to touch on the psychology of the gold market, there still appear way too many market participants and commentators that are bullish gold and expect this year to see in the final low. This was giving me a major case of the heebie-jeebies recently as I had the same outlook. It is pretty hard to find any analysis that is more than a little bearish and I now feel much more comfortable being against the overwhelming majority opinion.
Summing up, I expect deflationary forces to really pick up later this year and gold will not be spared despite the opinion of the masses.
And once this deflationary cycle has caused maximum damage to the bank accounts and psyche of the gold bulls, the long awaited boom should see the gold price explode higher as inflationary euphoria finally takes hold.
By Austin Galt
Austin Galt is The Voodoo Analyst. I have studied charts for over 20 years and am currently a private trader. Several years ago I worked as a licensed advisor with a well known Australian stock broker. While there was an abundance of fundamental analysts, there seemed to be a dearth of technical analysts. My aim here is to provide my view of technical analysis that is both intriguing and misunderstood by many. I like to refer to it as the black magic of stock market analysis.
Email - info@thevoodooanalyst.com
© 2015 Copyright The Voodoo Analyst - All Rights Reserved
Disclaimer: The above is a matter of opinion provided for general information purposes only and is not intended as investment advice. Information and analysis above are derived from sources and utilising methods believed to be reliable, but we cannot accept responsibility for any losses you may incur as a result of this analysis. Individuals should consult with their personal financial advisors.
Austin Galt Archive |
© 2005-2022 http://www.MarketOracle.co.uk - The Market Oracle is a FREE Daily Financial Markets Analysis & Forecasting online publication.


