Gold Weekly COTs and More
Commodities / Gold and Silver 2015 Feb 23, 2015 - 10:44 AM GMTBy: Dan_Norcini
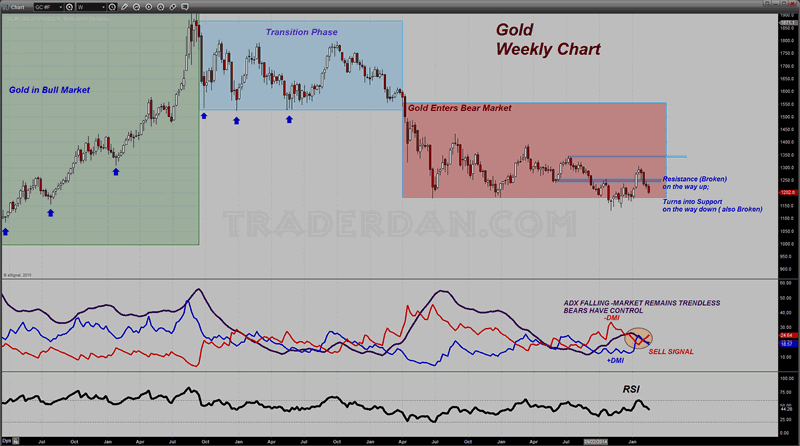
 Fading Greece concerns were a tough headwind for the yellow metal this week and it certainly had a negative impact on the intermediate-term chart.

As you can see, gold has now fallen the last 4 weeks in a row after failing at the $1300 level. This week it failed at the $1200 level as well although it is barely hanging above the latter by the skin of its chinny-chin-chin.
The chart thus looks heavy heading into next week.
The technical indicators noted below show the ADX line is still moving lower, indicating the market still remains in a trading range. It is currently approaching the bottom of that range which lies near $1180.
The -DMI, Negative Directional Movement line, remains well above the +DMI, noting that the bears are in control of the market as it moves down for a possible test of the bottom of the range next week.
The RSI failed to extend past 60 on the rally that started at the first of the year and is now moving lower as well. This is confirming that the rally lacked internal strength. The question that traders are now asking is whether or not the active buying that gold experienced near $1180 and below is still there or whether the rotation back into equities is going to lure them back out of the precious metals sector and back into the broader equity markets in general.
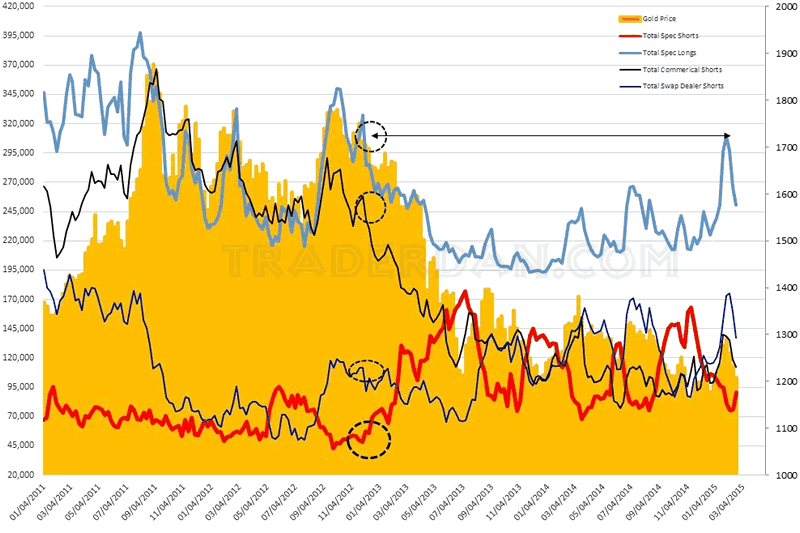
One of the major technically-related headwinds that gold faces in my view is that still rather lopsided speculative long position that overhangs this market.
Remember, that position was built ahead of the ECB decision whether or not to engage in a round of QE. It was further buttressed by concerns over the future of the Euro currency especially in relation to Greece ahead of the rather recent election.
Now that those issues are beginning to fade from traders' radar screens, gold has a large number of longs whose positions are increasingly going underwater.

Based on my analysis of the most recent COT data, and the gold price chart noted in the graph above, there are about 25,000 remaining speculative long positions that were put on when gold was trading closer to the $1195 or so level. Nearly every single one of the NEW LONG positions put on since the start of the year are underwater (those which have not already bailed out). A push below $1180 will put them all underwater. At that point, one has to allow the possibility of a significant amount of POTENTIAL SELLING due to the long liquidation.
I might add here that the only potential source of FUNDAMENTAL based support I can see remaining in gold at this point is the potential for some further flare ups involving the Ukraine situation.
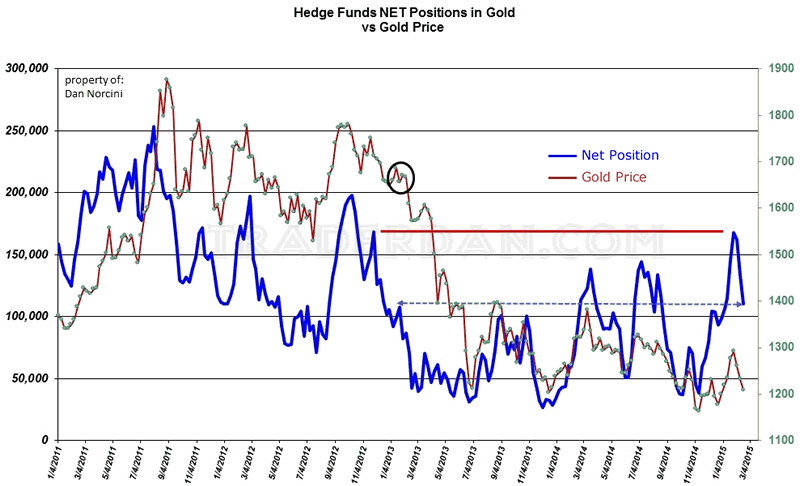
Let me come back to that COT however and show you the reason for my concern in a bit less cluttered chart - this one shows only the NET LONG position of the HEDGE FUND category in relation to the gold price.

I have drawn in two horizontal lines on this chart. The first is the solid red line showing the recent peak in their net long position had hit levels last seen back in late 2012 back when gold was near $1700. It has bled down considerably over the last three weeks but now note the dashed horizontal line drawn over to the left connecting their current net long position as of this week to where it was in the past. Can you see that the last time the position was of similar size, the price of gold was over $1650!
That is an awful lot of stale longs just sitting there threatening to go underwater. That is what makes me nervous about this market. As noted above, without Ukraine sitting out there to give the bulls some fodder, what is left at this point?
Here is the thing - those of us who trade for a living do not have the luxury of trading, "what if's". We have to trade what is in front of us. Yes, we can keep potential price movers in the back of our minds (such as Ukraine) but one thing I have learned in this business over the many years I have been in it, is that nothing is a problem until it is a problem. Until it is, trading based off of POTENTIAL events, is a sure fire way to financial ruin as a trader.
Trade the tape in front of you. Unless/until it actually CONFIRMS your view of the market, your view is the wrong view. Don't forget that...
Dan Norcini
Dan Norcini is a professional off-the-floor commodities trader bringing more than 25 years experience in the markets to provide a trader's insight and commentary on the day's price action. His editorial contributions and supporting technical analysis charts cover a broad range of tradable entities including the precious metals and foreign exchange markets as well as the broader commodity world including the grain and livestock markets. He is a frequent contributor to both Reuters and Dow Jones as a market analyst for the livestock sector and can be on occasion be found as a source in the Wall Street Journal's commodities section. Trader Dan has also been a regular contributor in the past at Jim Sinclair's JS Mineset and King News World as well as may other Precious Metals oriented websites.
Copyright © 2015 Dan Norcini - All Rights Reserved
All ideas, opinions, and/or forecasts, expressed or implied herein, are for informational purposes only and should not be construed as a recommendation to invest, trade, and/or speculate in the markets. Any investments, trades, and/or speculations made in light of the ideas, opinions, and/or forecasts, expressed or implied herein, are committed at your own risk, financial or otherwise. The information on this site has been prepared without regard to any particular investor’s investment objectives, financial situation, and needs. Accordingly, investors should not act on any information on this site without obtaining specific advice from their financial advisor. Past performance is no guarantee of future results.
© 2005-2022 http://www.MarketOracle.co.uk - The Market Oracle is a FREE Daily Financial Markets Analysis & Forecasting online publication.


