Long-term Relationship Between Gold and Crude Oil Price Challenged
Commodities / Gold and Silver 2015 Feb 05, 2015 - 06:55 PM GMTBy: Clif_Droke

 Wall Street breathed a sigh of relief this week after a case of the jitters the last couple of weeks. Fears over a deflationary plunge in the euro zone had sparked an increased demand for safe haven assets, including gold and silver. The decline to multi-year lows in the crude oil market as recently as a few days ago also fed into investors’ desire for safety. In the last couple of days, however, those fears have at least momentarily abated as the oil price has rallied while Treasury prices and the U.S. dollar have declined. Consequently, gold and silver safe haven demand has declined in recent days.
Gold prices were down more than 1% on Tuesday on news that Greece’s government had dropped calls for a write-off of its foreign debt. This was one of the main factors behind Wall Street’s case of the jitters in the last two weeks. Equity prices rallied sharply Tuesday while U.S. Treasury bonds had their worst 1-day showing in over a month, with the 10-year Note down over 2%.
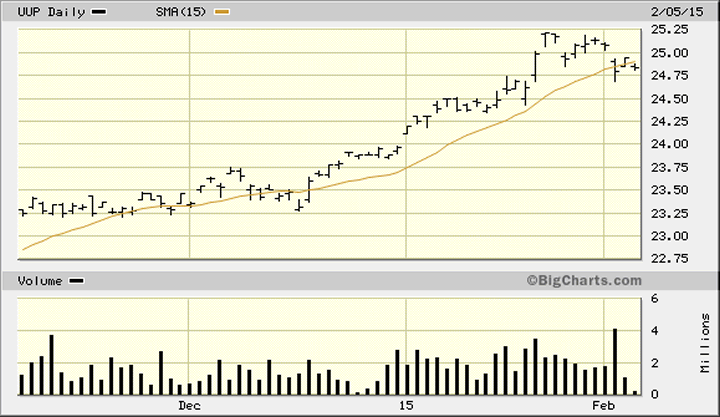
The U.S. dollar ETF (UUP) meanwhile closed decisively under its 15-day moving average for the first time this year (below). This constitutes a serious challenge to the immediate-term (1-3 week) uptrend; whether the dollar bears are up to the task of forcing the dollar’s value lower from here remains to be seen in the all-important follow-through sessions.

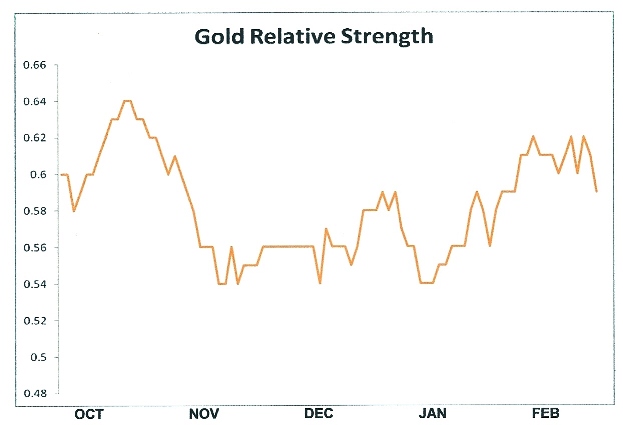
Whether or not Tuesday’s turnaround was the start of renewed “risk-on†approach among investors remains to be seen. An upside follow-through in equities in the next couple of sessions would almost certainly weigh on gold’s safe haven demand. A failure to maintain support above the dominant short-term trend line for gold (see paragraph below) would also bode ill for the yellow metal’s prospects in February. A continuing concern I have for the metal is the failure of gold’s relative strength line to keep pace with the gains of the actual gold price in January (see chart below). Ideally, gold’s relative strength line should be confirming any strength in the precious metal’s price to let us know gold is in strong hands.

It’s significant that gold was down this week at the same time that U.S. Treasuries were sharply lower. In the past, rising bond prices (and falling yields) were bearish for gold and silver since a bullish bond market was viewed as a sign that investors were becoming risk-averse by chasing the speculative rally in bonds. In recent months, however – and with international bond yields approaching zero in some cases – lower yields and higher bond prices have galvanized investor interest in the precious metals. This is due to, among other things, the lack of income opportunities from Treasury instruments along with the concomitant fear of deflation.
In a note to clients on Tuesday, BoA/Merrill asserted that a “decoupling†was taking place between gold and its century-old relationship between oil and is now being driven by movements in interest rates and currencies. BoA/ML analyst Michael Widmer said, “We think that a unique combination of factors is again making gold attractive in investor portfolios: negative nominal interest rates, a closing volatility gap to other asset classes, and improving weekly returns.†This is certainly a point worth considering, although it’s still much too early to state with any certainty that the long-term positive correlation between gold, oil and interest rates is officially over. The coming months will likely reveal whether this burgeoning relationship is merely a temporary intermediate-term transitional phase or the start of a new long-term inverse relationship among gold, oil and bond prices.
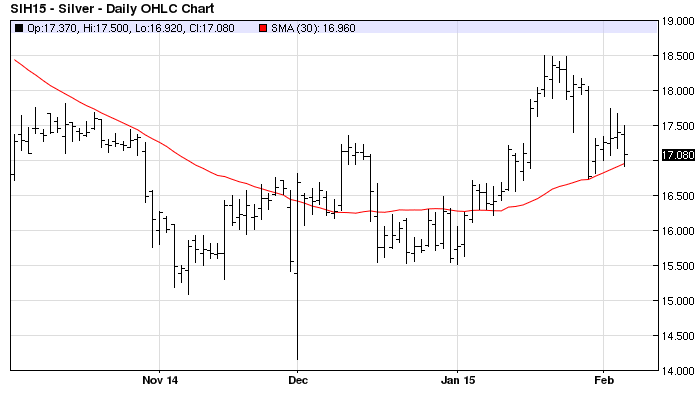
After rising more than 8% in January for its best monthly performance in three years, gold prices are still above the short-term (30-day) moving average but below the immediate-term 15-day MA. The 30-day MA is also where the silver price found support after its sharp decline last week, as the following graph illustrates. The 30-day MA is significant since it has proven to be a pivotal guide line for gold, and especially silver, prices in the last two years. Whenever the silver price has decisively broken under its 30-day MA a sharp decline has usually followed. It’s imperative that silver maintain support above the 30-day trend line in the critical days ahead.

On the ETF front, fresh inflows were reported into gold funds on Monday, with holdings of the SPDR Gold Shares ETF (GLD) climbing to their highest since October at 24.65 million ounces. I don’t consider this news significant to the short-term outlook, however, as inflows can go both ways depending on the volatile psychology of fund managers.
Mastering Moving Averages
The moving average is one of the most versatile of all trading tools and should be a part of every investor's arsenal. The moving average is one of the most versatile of all trading tools and should be a part of every investor's arsenal. Far more than a simple trend line, it's a dynamic momentum indicator as well as a means of identifying support and resistance across variable time frames. It can also be used in place of an overbought/oversold oscillator when used in relationship to the price of the stock or ETF you're trading in.
In my latest book, "Mastering Moving Averages," I remove the mystique behind stock and ETF trading and reveal a completely simple and reliable system that allows retail traders to profit from both up and down moves in the market. The trading techniques discussed in the book have been carefully calibrated to match today's fast-moving and sometimes volatile market environment. If you're interested in moving average trading techniques, you'll want to read this book.
Order today and receive an autographed copy along with a copy of the book, "The Best Strategies For Momentum Traders." Your order also includes a FREE 1-month trial subscription to the Momentum Strategies Report newsletter: http://www.clifdroke.com/books/masteringma.html
By Clif Droke
www.clifdroke.com
Clif Droke is the editor of the daily Gold & Silver Stock Report. Published daily since 2002, the report provides forecasts and analysis of the leading gold, silver, uranium and energy stocks from a short-term technical standpoint. He is also the author of numerous books, including 'How to Read Chart Patterns for Greater Profits.' For more information visit www.clifdroke.com
Clif Droke Archive |
© 2005-2022 http://www.MarketOracle.co.uk - The Market Oracle is a FREE Daily Financial Markets Analysis & Forecasting online publication.


