Decoding the Gold COTs: Myth vs Reality
Commodities / Gold and Silver 2015 Jan 26, 2015 - 10:17 AM GMTBy: Dan_Norcini
 Over the many years that I have been writing about the commodity futures markets, I have tried to make a point of homing in on the fact that it is the presence of high-powered speculative money flows that drive market action.
Whenever commentators speak of fundamental factors that should go into determining the price of any commodity, they tend to generally speak in terms of demand for the physical product versus the amount of supply for that same product. More often than not, omitted from the discussion is the role that speculators play.
Now some may find that odd, but nonetheless, it is a fact, that a failure to understand the role of speculative money flows, leads to a failure in understanding their role in the price discovery process.
Take gold for example - most of the time, the fevered gold bugs are usually ranting about the "corrupt Comex paper market" or "the Crimex" as they delight in calling it. One rarely hears a peep out of this crowd whenever gold is storming higher for it is as if "The Crimex" has suddenly become virtuous and a place overabounding in pristine purity. Let the price of gold fall for any reason, and the place once more suddenly morphs into a "den of thieves", "a cesspool of iniquity" which must one day get its comeuppance from one of the many new gold futures market that appear outside of the US.
What these dense-minded nitwits seem incapable of understanding however, is that speculative demand in the PAPER markets greatly influences the physical markets. We see this all the time in the livestock markets where the cattle or hog markets will break lower or rally higher BEFORE THE CASH MARKET responds. Once the Board moves, the cash then follows. The reason for that is simple - those entities which do business in the physical market will establish HEDGES prior to action they take in the cash markets. That allows them to get the hedges on at advantageous prices. After their buying or selling moves the Board far enough, speculators then pile on as the initial buying or selling of the commercials triggers the movement in price that in turns moves the technical indicators which determines the buying or selling of the specs.
This is an important thing to understand because the very purpose of the futures markets coming into being was to serve as a place where commercial entities, producers, end users, etc., that deal with the actual underlying commodity, could offload RISK to speculators who were willing to assume that risk in the hope of making a profit by so doing.
HEDGERS count on this speculative activity - at least good hedgers do! (Poor hedgers forget that they are HEDGERS and morph into speculators too often - that is when they usually end up wrecking themselves). Wise specs understand that signs of commercial hedging are clues to the DEMAND or SUPPLY coming into the market. They then react accordingly.
That being said, following the speculator activity, gives one the sense of SENTIMENT and it is sentiment that drives markets. This brings me to the current sentiment in the gold market.
Following will be two charts that portray this for us. The First is the NET POSITION of the largest group of speculative forces in the markets today and that is the Hedge Funds. Overlaid upon that graph is the price of gold.
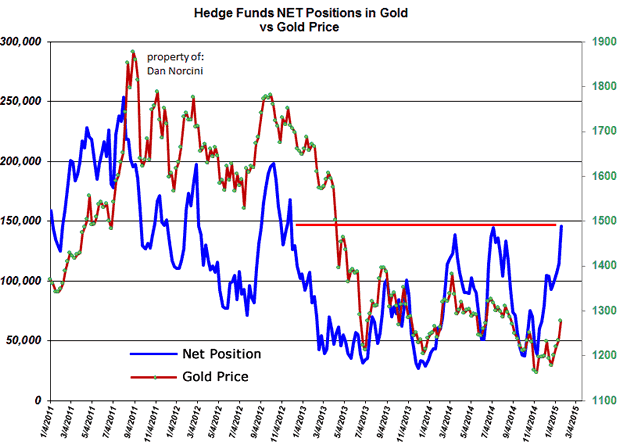
Notice how precise the movement of the speculative Hedge Fund category is in relation to the gold price. As their net long position increases, the price of gold rises. As that same position falls, so too does the price of gold. The relationship is absolutely perfect. It does not matter what some "evil gold cartel" might or might not be doing. As long as these hedge funds are buying, the price rises. Once they stop, the price falls.
As you can currently see by the sharp rise in the BLUE LINE, sentiment in favor of gold has been rising recently among the hedge fund contingent. Look at how the gold price has responded. Again - it is all about money flows.
There is something however that I have also noted when studying the charts. That is what this next chart illustrates.
This is the TOTAL OUTRIGHT LONG positions held by ALL THREE CLASSES of speculators - (1.) the hedge funds, (2.) other large reportable traders such as floor traders, non-registered CTA's and CPO's and large private traders, and (3.)the small traders or general public. By looking at this number, ita true sense of speculative demand or the lack thereof can be determined.
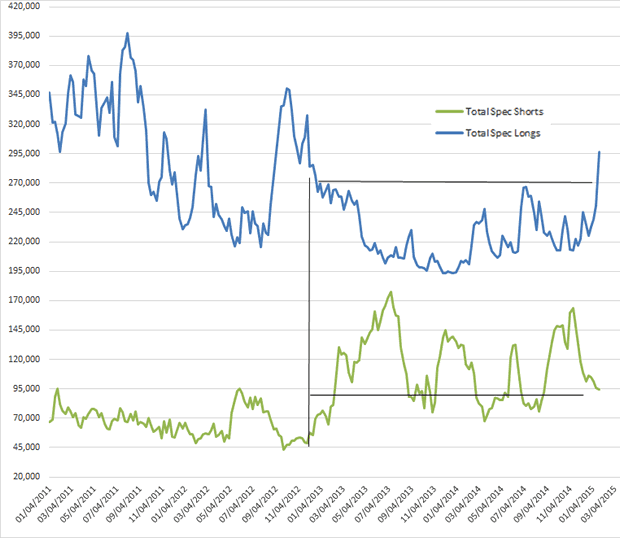
Are you noticing anything about this chart? You might have seen the ENORMOUS SPIKE in the total long positions being held by the speculators. Clearly speculators have come rushing back into gold here to start off the new year (they did the same exact thing to start of last year as well). As a matter of fact, the amount of new long positions has catapulted sharply higher leaping a whopping 70,000 new long positions in the last 4 weeks!
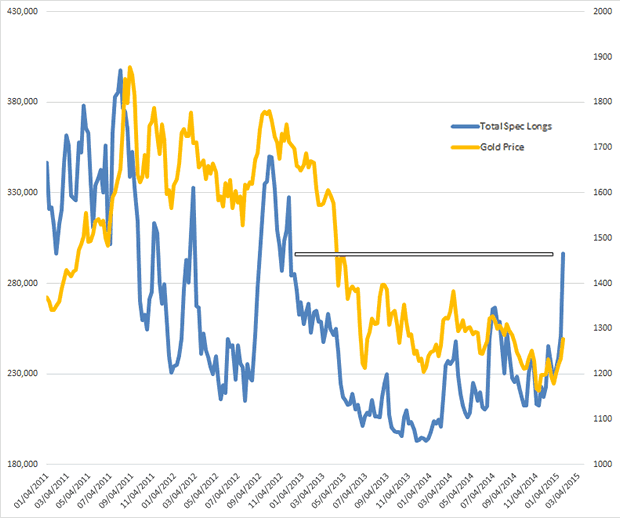
Look at the gold price however and compare where it is currently trading ( remember this is through Tuesday of last week) and to the level where it was formerly trading the last time the total long position of the speculative category was up at these lofty levels. Do you see that? Gold was trading near $1700 back in late 2012 when the combined number of speculative long positions was near its current level. (I have sketched a rectangle across the chart to show the level of long positions).
That is rather disconcerting if one is inclined to be bullish the metal. What it tells us is that a very large number of market participants are eager to sell gold. How else to explain the inability of the bulls to take the gold price anywhere near $1700 when the same level of buying was able to do so back in late 2012.
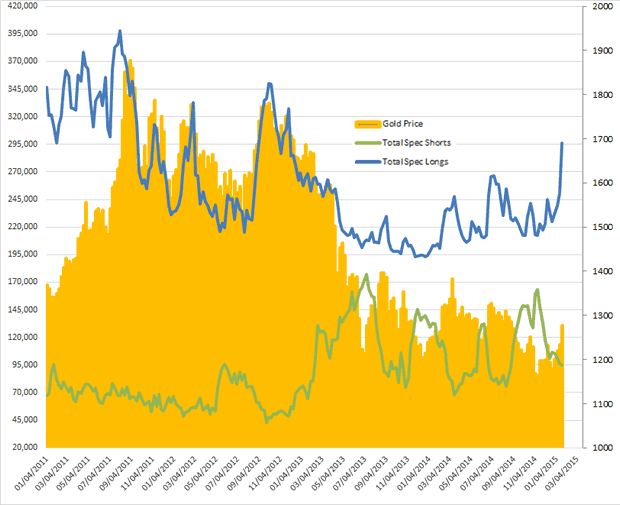
Here is the reason for this: This is the same chart but this time it includes the TOTAL OF OUTRIGHT SHORT positions held by all three speculative categories comparing that to the price of gold.
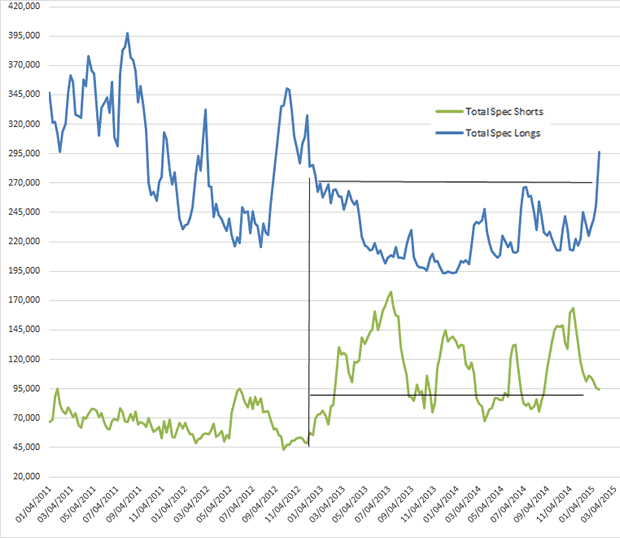
Digging in a bit further and actually comparing the outright spec long positions against the number of outright spec short positions yields further insight. Run your eye across the chart and look at those lines I have drawn in. The upper line notes the last time that the specs were holding a combined total number of long positions near the current level - that was back in Late November 2012/early December 2012 when gold was nearer $1700.
Now drop down the line vertically and note the number of combined short positions of the specs at that time. It was near the LOWEST LEVELS in some time. That tells me that relatively few speculators were bearishly inclined towards gold back when it was trading near $1700.
Now move your eye back to the right to the current week and look at how many more speculators are bearishly inclined towards gold than at that previous period. It is a bit difficult to tell the exact number from the chart but there are approximately 50,000 more short positions being held by speculators at the current time than when the comparable number of outright longs was last held by this same group.
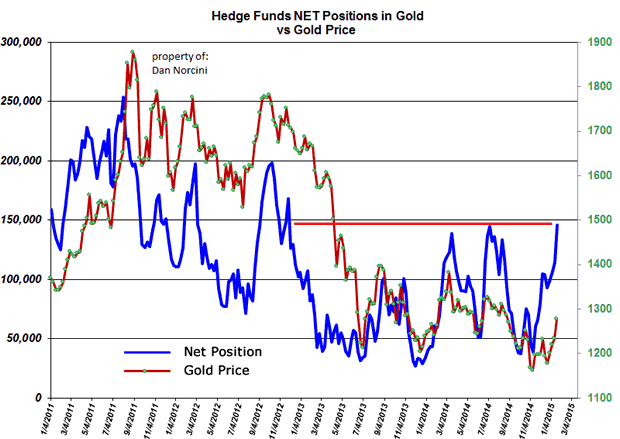
The last chart is merely a repetition of the first one shown but which can now be viewed with perhaps a bit more understanding/perspective. You can see the sharp surge in the NET LONG position of the hedge funds only. Run your eye across to the left and note the last time it was near this level. Again, same time frame as above, late November 2012-early December 2012. You can clearly see the significantly higher gold price at that time.
I ran through this entire exercise not to bore the reader with minutiae but rather to illustrate the internals in this market. While there are clearly a revived number of bulls at work in the gold market of late, it is also equally clear that there is a growing number of speculators who are bearish on gold. That tells me it is going to take significantly more buying to drive the price of gold higher this time around than it took several years ago. They face much more resistance from a much more skeptical crowd of speculators within their midst than those who opposed them previously.
Just keep this in mind whenever you read the wild and outlandish claims that are coming out of the gold bug community and its gurus. Once more at the risk of repeating myself - stay objective and keep your emotions in check and use your head. If you listen to the market you will not go wrong. If you choose to listen to the sensationalists who have been wrong time after time after time, you will once more be setting yourself up for heartache.
Dan Norcini
Dan Norcini is a professional off-the-floor commodities trader bringing more than 25 years experience in the markets to provide a trader's insight and commentary on the day's price action. His editorial contributions and supporting technical analysis charts cover a broad range of tradable entities including the precious metals and foreign exchange markets as well as the broader commodity world including the grain and livestock markets. He is a frequent contributor to both Reuters and Dow Jones as a market analyst for the livestock sector and can be on occasion be found as a source in the Wall Street Journal's commodities section. Trader Dan has also been a regular contributor in the past at Jim Sinclair's JS Mineset and King News World as well as may other Precious Metals oriented websites.
Copyright © 2015 Dan Norcini - All Rights Reserved
All ideas, opinions, and/or forecasts, expressed or implied herein, are for informational purposes only and should not be construed as a recommendation to invest, trade, and/or speculate in the markets. Any investments, trades, and/or speculations made in light of the ideas, opinions, and/or forecasts, expressed or implied herein, are committed at your own risk, financial or otherwise. The information on this site has been prepared without regard to any particular investor’s investment objectives, financial situation, and needs. Accordingly, investors should not act on any information on this site without obtaining specific advice from their financial advisor. Past performance is no guarantee of future results.
© 2005-2022 http://www.MarketOracle.co.uk - The Market Oracle is a FREE Daily Financial Markets Analysis & Forecasting online publication.


