


Gold And Silver Timing Is Most Important Element
Commodities / Gold and Silver 2015 Jan 25, 2015 - 12:15 PM GMTBy: Michael_Noonan

 "Excuse me, sir, do you have the time?"
In a Clinton-esque response: "It depends on what the definition of "time" is."
Throughout much of 2013 and all of 2014, there were numerous stories/reports out on what would have to be considered as very bullish prospects for the prices of gold and silver. There were calls for gold to rally anywhere from $3,000 to over $25,000 the ounce, $100 to over $500 the ounce for silver. Almost no one called for both metals to make new recent lows by the end of 2014, where gold was $1,180 and silver $15,50. This was a far cry from even the most conservative bullish calls for much higher prices by the end of 2014.
We were not among those calling for higher prices by the end of 2014, but neither did we expect new recent lows to occur. What happened in the face of any number of bullish expectations? Among them were:
*Record sales for gold and silver coins to the public *Huge lines of Chinese citizens buying gold coins, bars, and jewelry [Just goes to prove that the public always buys highs and never picks bottoms.] *Record purchases of physical gold by both China and Russia *Depletion of inventory at COMEX and LMBA *Hypothecation, rehypothecation, and more re-rehypothecation by US/UK central banks, to the point where there was little to no gold left in central bank vaults *Germany demanding repatriation of its gold from the NY Fed, which said there were "logistics problems" for shipping the gold to Germany. [Can't ship what you don't have.] *The expected demise of the Federal Reserve Note, called the "dollar," as a world reserve currency *Establishment of the BRICS nations to compete against Western central bankers *A new world gold standard to replace all fiat currencies * Etc, etc, etc...
[We are not sure of what the odds are for a new gold standard but would guess them to be less than 50-50.]
What do they all have in common? A lack of timing. The real question was not what time it was but what "time," as in "when" would gold and silver rally in answer the response of "It depends on what the definition of "time" is." To date, there is still no answer.
Ostensibly, we would say the best answer comes from a reading of the charts, but there are a number of "chartists" who misuse charts to make projections by adding arrows or dotted lines pointing higher into the future, with little to no basis for accuracy for none panned out as projected. That does not mean reading developing market activity on a chart will be misleading. In fact, when using a chart to define the trend and placing the current market activity into a context, one gets a pretty good read of reality.
Do charts pick market tops and bottoms? Absolutely! The qualifier is that neither the top nor bottom can be recognized until some time after the fact, as in several weeks or months, in most cases. That happens to be reality, and in homage to that fact is the old saw: more money is lost trying to picks tops and bottoms than at any other time. In this respect, an accurate reading of chart/trend development is superior to almost every other form of market prognostication.
Consider this: The 2007-2008 stock market top was not confirmed until a few months after a top was established. What happened afterwards, and there may be many among you who can attest to this, is that the world of fundamental and so-called value analysis was turned upside down when the stock market cratered to the utter shock of those who ignored an after-the fact-confirmation of an established top. There was still ample time to have exited from the stock market relatively intact.
The same is true for the gold and silver market. Has a bottom been confirmed? Not by our standard of confirmation, although January has made an impact in viewing the lows of November 2014 as a potential bottom. There has been a decided change in market behavior not seen since the decline off the 2011 highs.
There will be some who may "predict" or pinpoint the market bottom when it occurs, but most of those who make such a call will be the same ones who have previously already [and incorrectly] made a market bottom call in the past several months. They rely on forgiving short memories of the public for past errors.
With that, here is our current view of the ongoing developing market activity. It is always good to keep a perspective on the market and not get caught up in the smaller time frame activity. This weekly silver chart accomplishes just that as it shows how much work needs to be done to alter the current down trend.
Chart comments are directed to the small range of last week as a red flag warning that the rally could undergo a correction, starting as early as next week. The read does not require "predicting" what the market may or may not do, but rather just pay attention to the how a market develops for clues of what may develop. It then puts us in a position to be prepared for what may follow that could lead to an opportunity.
Of course, the weekly chart is not used for timing. For that, we look at the daily.
Silver Weekly Chart
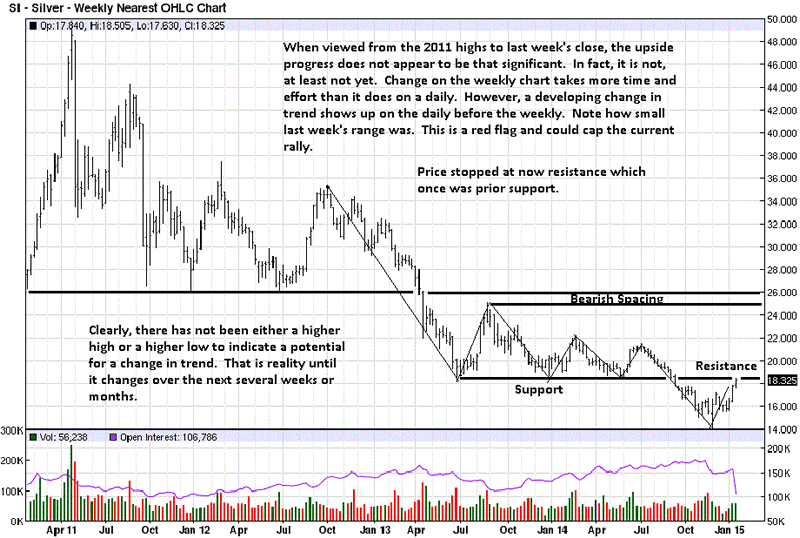
If price were to retrace lower, sometime next week, a logical are of support appears to be the 17.25 area. This is where price accelerated down at the end of last October, and it is also the last failed rally high in mid-December. Putting developing market activity into a context like this enables us to be prepared for a trading opportunity with a defined risk,
Silver Daily Chart
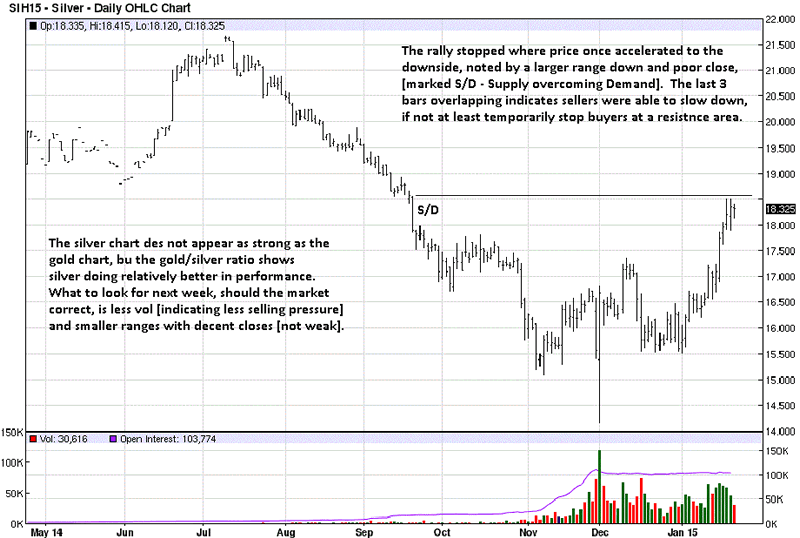
The chart comments covers what can be said. Last week's small range provides the same red flag warning that sellers showed up and stopped buyers from extending the rally higher. The daily will give a more detailed read.
Gold Weekly Chart
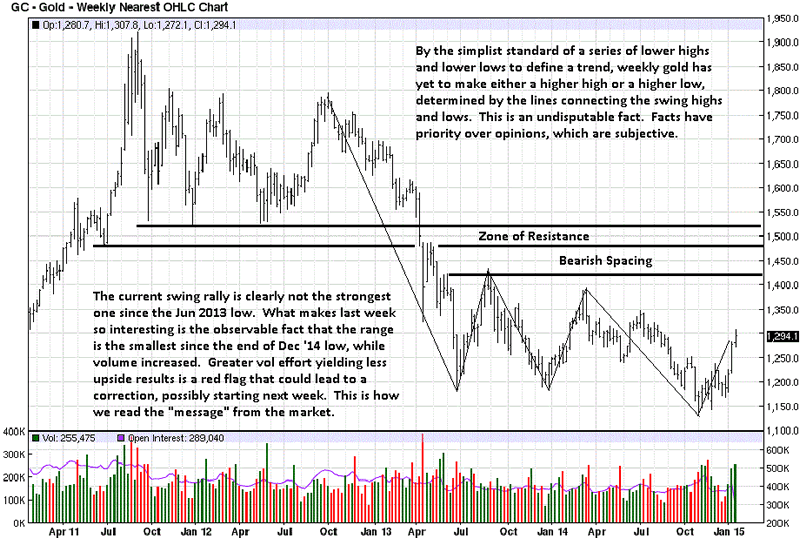
The small weekly range is comprised of bars that are overlapping. Compare those 4 TDs to the bars that comprise the rally up to that point, and you will see less overlapping as price rallied. When sellers are able to match the effort of buyers, the rally stalls, as it did the last 4 days. This action typifies what can lead to a corrective reaction lower. The possibility exists that the overlapping bars could also be a pause before the current rally resumes and goes yet higher without correcting.
There is now a higher swing low and a higher swing high. If the next correction creates a 2nd higher swing low, it will confirm a trend change to the up side on the daily time frame. This can also set up a buy opportunity in the paper market.
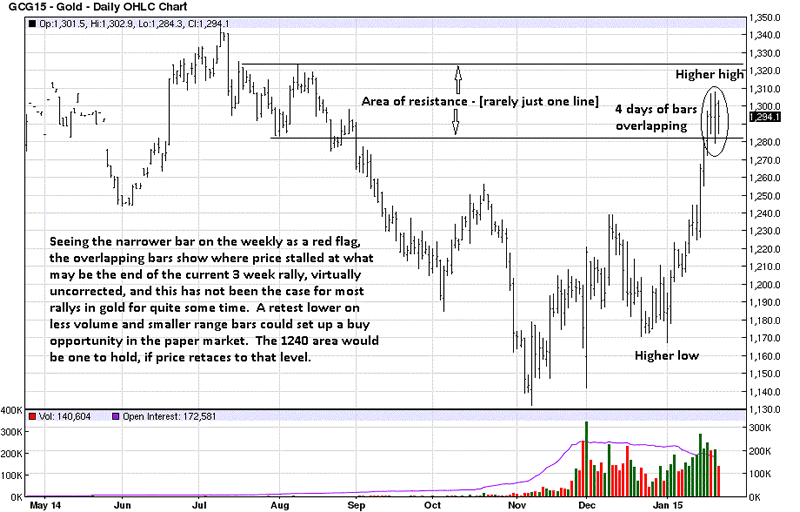
Gold Daily Chart
By Michael Noonan
Michael Noonan, mn@edgetraderplus.com, is a Chicago-based trader with over 30 years in the business. His sole approach to analysis is derived from developing market pattern behavior, found in the form of Price, Volume, and Time, and it is generated from the best source possible, the market itself.
© 2015 Copyright Michael Noonan - All Rights Reserved Disclaimer: The above is a matter of opinion provided for general information purposes only and is not intended as investment advice. Information and analysis above are derived from sources and utilising methods believed to be reliable, but we cannot accept responsibility for any losses you may incur as a result of this analysis. Individuals should consult with their personal financial advisors.
Michael Noonan Archive |
© 2005-2022 http://www.MarketOracle.co.uk - The Market Oracle is a FREE Daily Financial Markets Analysis & Forecasting online publication.