Stock Market Trend Points to Further Consolidation
Stock-Markets / US Stock Markets Jun 01, 2008 - 05:19 PM GMTBy: Andre_Gratian
 Current position of the Market
SPX: Long-term trend - So far, the market has followed the decennial pattern in an election year. But the 6-yr cycle which is scheduled to bottom in late Summer/early Fall could play a restraining role, followed by an eventual bull market top in 2009-2010.
SPX: Intermediate trend - The intermediate correction came to an end on 3/17. The index is now in a cautious and tentative uptrend.
Analysis of the short-term trend is done on a daily basis with the help of hourly charts. It is an important adjunct to the analysis of daily and weekly charts which determines the course of longer market trends.
Daily market analysis of the short term trend is reserved for subscribers. If you would like to sign up for a FREE 4-week trial period of daily comments, please let me know at ajg@cybertrails.com .
Overview:
As anticipated, the short-term cyclical configuration called for a consolidation in the intermediate uptrend, and this is what has happened. The pull-back ended on May 23 and since then, indices have been trying to re-establish their uptrends.
The cycles have not affected, and are not affecting the market evenly. The degree to which the indices responded to the decline ranged from fairly shallow in the Russell 2000 to .618% in the Dow Jones Financial index (100% in the Banking index). The Dow Industrials retraced .50%, and the S&P 500 and Nasdaq roughly one-third. In the recovery, the Russell has already made a new high, and the Nasdaq 100 is very near its former highs. By contrast, the Dow Jones Industrials are severely lagging.
Generally speaking, the fact that the Russel and Nasdaq 100 have given a better performance both in the decline and in the rally has to be considered a positive for the overall market, since these indices are considered market leaders. But it does raise some question about the ability of all the indices to reach new intermediate highs before a more extended correction takes place as a result of the longer cycles bottoming in the Fall.
Friday's action suggested that we might have reached another short-term top. It was particularly remarkable that the NDX kept pushing forward and the SPX refused to follow its lead. Breadth, although it has remained positive on balance, has only been mediocre in the advances and the volume continues to be on the light side. Consequently, an observation of the market performance over the next couple of weeks will be needed to tell us what course the intermediate trend wants to follow
The overall impression that one gets from the market action is that most investors are still sitting on the sidelines, and this suggests that there may be a need for some additional intermediate consolidation before the indices are in a position to challenge their October 2007 highs.
I am certain that the Dow Theorists will also be quick to point out that the DJTA -- totally unaffected by the performance of oil -- has made a new bull market high, while the DJIA is still far from
What's ahead?
Chart pattern and momentum:
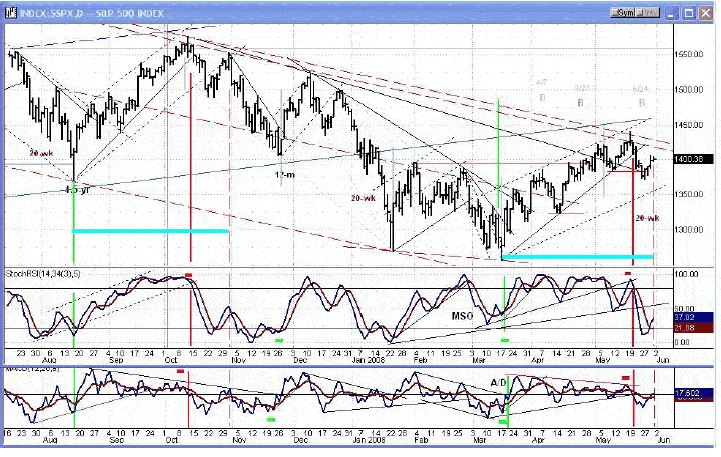
Two weeks ago, I wrote: On the chart below, notice how the SPX is moving into a wedge pattern. This reflects the lack of upside momentum which normally results in a reversal… But the A/D oscillator at the bottom of the chart is where the negative divergence is much more apparent . This is a pattern which is very similar to the one going into the October 2007 high. This does not suggest that it will be followed by a similar decline, only that a reversal normally occurs when prices and breadth describe this type of pattern.
My analysis has already been vindicated by the decline which has occurred. Now, with many of the indices lagging, as was mentioned above, we have to wonder if a larger decline is not about to take place before we can go and challenge the 1440 high on the SPX. Let's see if we can garner some insights from its daily chart and indicators.
First, note that the rally ended right at the declining dashed lines which, in my opinion, represent the top of the declining intermediate correction channel. Until these lines have been decisively penetrated, we will not be certain that the intermediate correction is over, and that we are ready to go and challenge the October highs.
Next, as mentioned in the quote, above, from the last Newsletter, look at the continuing similarity of the patterns beginning in mid-August and mid-March. Not only was the up-phase of these patterns very similar, but it appears that the down-phase is shaping up to be the same. This is pointed out in the time period above the light-blue horizontal lines on the chart. Note also that the similarity extends to both oscillators at the bottom of the chart -- with one possibly important difference: The A/D indicator (bottom) is not quite as weak today as it was then.
What this suggests is that, although both indicators do not appear ready to signal a continuation of last week's rally without further consolidation (they do not portray a "typical" bottoming formation where positive divergence is present), the lesser weakness in the A/D implies that if there is another leg to the decline which started at 1440, it will not be as extensive as the one going into the November low.

Cycles
Since the 20-wk cycle is clearly -- at least in part -- responsible for the decline from 1440 as well as last week's rally, it could be argued that if this short-term downtrend continues, prices may already be pressured by the longer term cycles due to bottom in the Fall.
Other cycles and CITs affecting the short-term in the near future will be a minor cycle due in the middle of next week, and two CITs due around 6/10-11. As we know, CITs can determine either a high or a low in the trend, but if they turn out to produce a low, we may then have the beginning of a deviation of the October fractal. By then, the short-term oscillators may be in a position to firmly indicate a low point in the pull-back and an attempt at resuming the intermediate low made in March.
Also take notice of the fact that the 5/27 Bradley date (which is itself more often than not a CIT) mentioned in the last Newsletter turned out to be the exact low of the decline in the SPX. The next one, due on 6/6, could either turn out to be a low in conjunction with the minor cycle bottom projected for next week, or a rebound high after the bottoming of that cycle before another low on 6/10-11.
Projections:
Written a month ago: There are 3 potential SPX projections to the upside for the end of the rally. The first was 1423 and was reached on Friday (5/1)… By reaching that level, the SPX had to go decisively beyond 1396, which it had resisted doing until last week. This triggers two other potential projections to higher levels: 1438 and 1470. At a maximum, if internals improve, the index could reach 1480.
So far, two of these projections, 1423 and 1438, have been reached almost on the nose and both have caused a retracement, which is what the market should do after a price target is met. As long as 1325 is not violated, the two remaining projections of 1470 and 1480 are still valid.
In the same Newsletter, I also wrote: On the downside, 1360 looks about right for the decline into the end of the month. This presumes that the SPX will break below its 1385 low.
The SPX did break below 1385, and the "about" 1360 projection is still valid.
Breadth
Since 4/18, the hourly A/D figures have barely topped 1200 on rallies, and have dropped to -1500/1700 on declines. This is not the sign of a healthy, broadly-based rally.
The MACD of the daily A/D also reflects this, as you can see on the chart above.
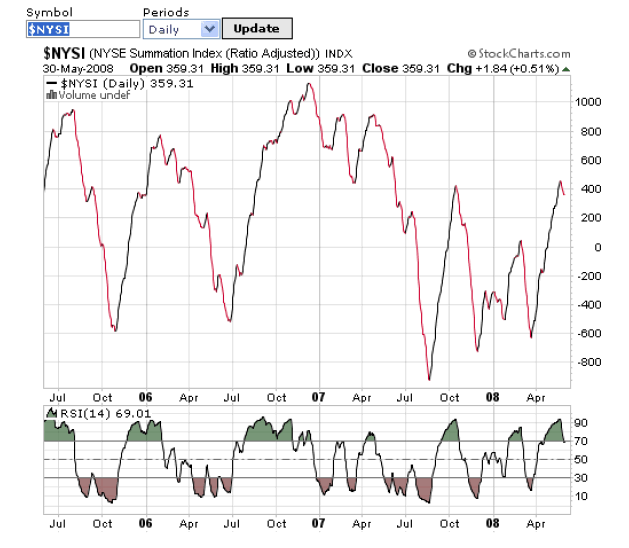
The New York Stock Exchange A/D Summation Index may be making the case for an extended consolidation of the intermediate trend. Look at the chart below (courtesy of StockCharts). Even though the daily A/D figures have been tepidly bullish, this index, which best reflects the intermediate condition of breadth, is showing a slightly overbought condition in its RSI. While this is not conclusive evidence that the pull-back will continue, it does show a similar pattern to the October high. This "fractal" similarity was discussed above.

Market Leaders and Sentiment
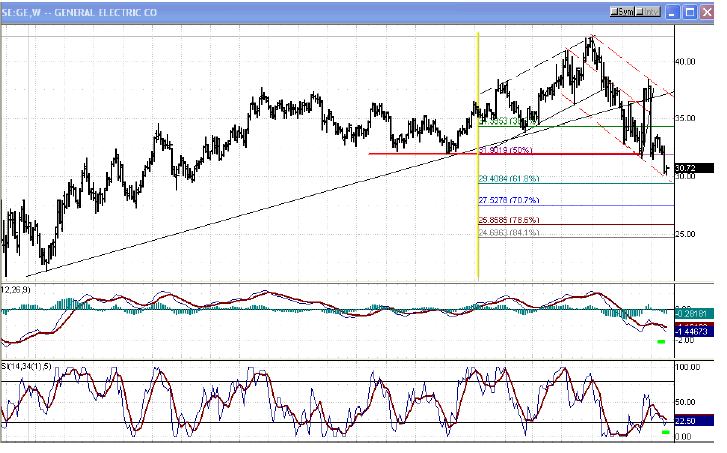
The contradiction between the NDX and GE continues. While the NDX is close to making a new recovery high, GE has just made a new bull market correction low. Here is the chart, and this is how I interpret it:

The stock is still in an intermediate correction and it is approaching a .618 retracement of the bull market uptrend. The price has just made a new intermediate low, but both of the momentum indicators below have not. This is positive divergence which is marked by a little green rectangle under the indicators. It tells me that even though the stock is being pulled toward the .618 level, which corresponds to about $29.50, there is a very good chance that it will find support at that price and begin an intermediate uptrend.
You can see how well the stock is observing the red-dashed lines which correspond to those of the SPX and which I take to represent the intermediate downtrend. Therefore, although the NDX is stronger than the SPX and suggests higher prices ahead, GE is saying, perhaps not right away. Furthermore, one could even conjecture that the odds of GE making a new bull market high in 2009-10 are not very good, and that while some indices will, in order to conclude their bull market run, GE will wave a big red flag calling for the end of the bull market.
Summary
Since it made its low in mid-March, the market is not giving us the unified and coherent picture of a strong intermediate uptrend, and while there may still be enough strength left in the SPX to slightly surpass 1440, some additional correction into the longer-term cycle lows due in the Fall appear more and more likely.
The following are examples of unsolicited subscriber comments:
What is most impressive about your service is that you provide constant communication with your subscribers. I would highly recommend your service to traders. D.A.
Andre, you did it again! Like reading the book before watching the movie. B.F.
I would like to thank you so much for all your updates/newsletters. As I am mostly a short-term trader, your work has been so helpful to me as I know exactly when to get in and out of positions. I am so glad I decided to subscribe to Turning Points… Please rest assured that I shall continue to be with Turning Points for a long time to come. Thanks once again! D.P.
But don't take their word for it! Find out for yourself with a FREE 4-week trial. Send an email to ajg@cybertrails.com .
By Andre Gratian
MarketTurningPoints.com
A market advisory service should be evaluated on the basis of its forecasting accuracy and cost. At $25.00 per month, this service is probably the best all-around value. Two areas of analysis that are unmatched anywhere else -- cycles (from 2.5-wk to 18-years and longer) and accurate, coordinated Point & Figure and Fibonacci projections -- are combined with other methodologies to bring you weekly reports and frequent daily updates.
“By the Law of Periodical Repetition, everything which has happened once must happen again, and again, and again -- and not capriciously, but at regular periods, and each thing in its own period, not another’s, and each obeying its own law … The same Nature which delights in periodical repetition in the sky is the Nature which orders the affairs of the earth. Let us not underrate the value of that hint.” -- Mark Twain
You may also want to visit the Market Turning Points website to familiarize yourself with my philosophy and strategy.www.marketurningpoints.com
Disclaimer - The above comments about the financial markets are based purely on what I consider to be sound technical analysis principles uncompromised by fundamental considerations. They represent my own opinion and are not meant to be construed as trading or investment advice, but are offered as an analytical point of view which might be of interest to those who follow stock market cycles and technical analysis.
Andre Gratian Archive |
© 2005-2022 http://www.MarketOracle.co.uk - The Market Oracle is a FREE Daily Financial Markets Analysis & Forecasting online publication.


