


Gold Price Reaches First Target – Potential Short-term Pull Back Now Possible
Commodities / Gold and Silver 2015 Jan 21, 2015 - 11:22 AM GMTBy: MarketsToday

 As discussed in our last analysis on gold from January 4, a bearish AB=CD pattern was forming with a 100% D leg completion at 1,273.9. That price target was reached last Friday as gold hit a high of 1,282.11 for the week. Although not assured, a pullback is now possible. In addition to the ABCD completion, potential resistance can also be seen in this general price area from previous price structure (support and resistance).
Alternatively, a decisive rally above last week’s high could see gold hit its next target of approximately 1,302.8, the 127% Fibonacci projection of the CD leg.
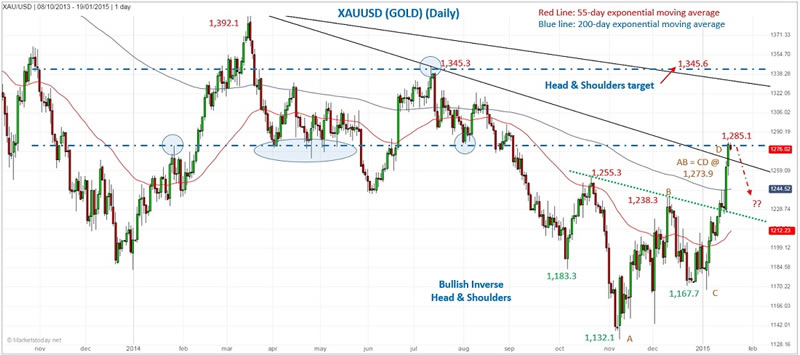
In addition to the AB=CD pattern, a bullish breakout of an Inverse Head & Shoulders pattern began a couple of weeks ago. Therefore, a decline down to the neckline might be considered the lowest price level before support would be found, if a retracement occurs from current levels. Higher price levels are the previous peaks marking the neckline, first at 1,255.30 and then 1,238.30. Fibonacci levels include the 38.2% retracement at 1,226.65, and the 50% at 1,208.60 (measured from 1,132.1 low).
The odds of a higher rally following a pullback are good. A couple of the supporting factors are as follows:
•Inverse Head & Shoulders minimum target not yet reached
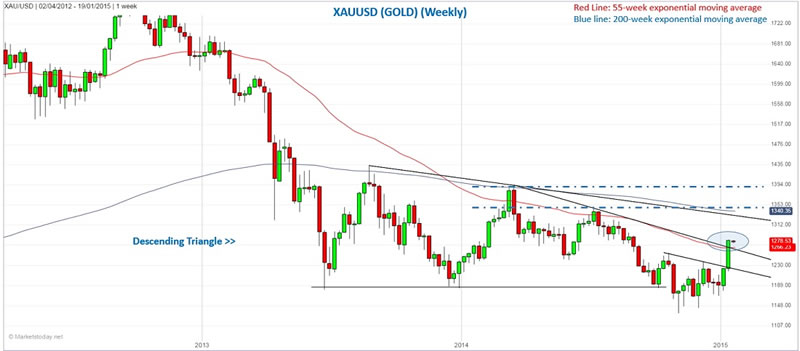
•Weekly close occurred above the internal downtrend line. The next and longer downtrend line, across the top of a large descending triangle, is higher.
•Weekly close above the 55-week exponential moving average (ema). Last week was the first time there’s been a weekly close above the 55-week ema since early-July 2014, and only the third time since gold’s decline accelerated in April 2013. However, note that each of the two prior moves above the 55-week lasted no more than two weeks (not bullish).
•Back above the 200-day ema for first time since August 2014
About MarketsToday.net: MarketsToday.net® is an online financial portal covering the Middle East stock markets, plus spot Forex, oil, and precious metals, published in both Arabic and English. It is designed to help keep investors and traders up-to-date with the latest news, quotes, performance trends, and market developments in the Middle East stock markets.
Copyright 2015 © MarketsToday - All Rights Reserved
Disclaimer: The above is a matter of opinion provided for general information purposes only and is not intended as investment advice. Information and analysis above are derived from sources and utilising methods believed to be reliable, but we cannot accept responsibility for any losses you may incur as a result of this analysis. Individuals should consult with their personal financial advisors.
© 2005-2022 http://www.MarketOracle.co.uk - The Market Oracle is a FREE Daily Financial Markets Analysis & Forecasting online publication.