Silver Price Breaks Out on Swiss France Euro Decoupling
Commodities / Gold and Silver 2015 Jan 19, 2015 - 06:41 PM GMTBy: Clive_Maund
 Silver broke out from a Head-and-Shoulders bottom on Friday, a day after gold did the same following the news that the Swiss Franc is to be decoupled from the euro. In the face of the impending QE tsunami in Europe, the Swiss have decided to call it a day and give up supporting the euro peg and retreat to the relative safety of the mountains, where at least they will have a plentiful supply of their high quality cheese and chocolate, as foreigners are less able to buy it. The reason that gold and silver broke higher is that the Swiss move is an unwelcome reminder of the ongoing and intensifying global currency war, characterized by competitive devaluation and bouts of QE. When there is more and more money and it buys less and less, gold and silver must go up in price - that's not too difficult to understand, is it??
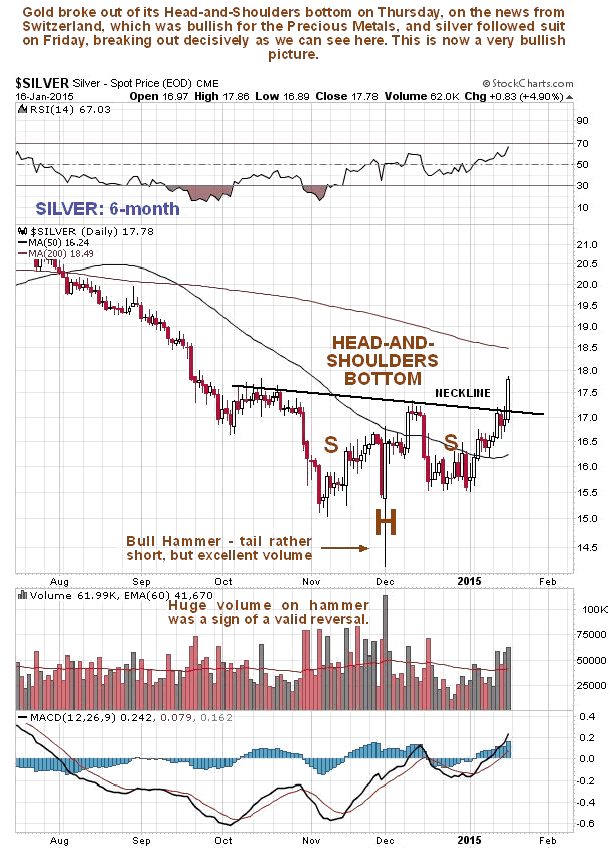
On silver's 6-month chart shown below, we can see the clear breakout on Friday from the Head-and-Shoulders bottom. This is now a bullish picture and momentum is swinging positive, although as we later see, the latest COTs and sentiment indicators suggest that silver is not going to have such an easy time of it breaking through the strong resistance in the $18 - $19 area.
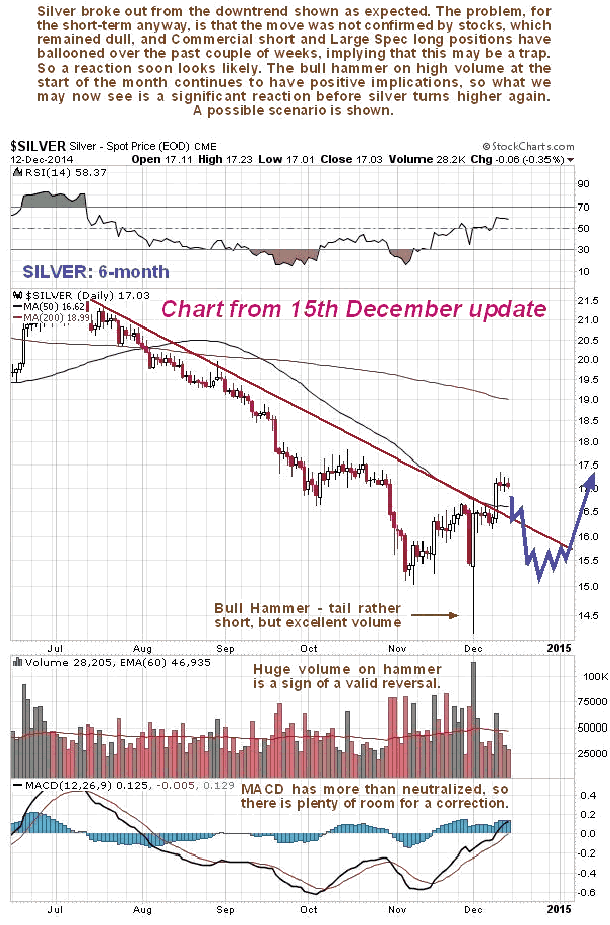
The action of the past month in silver was predicted almost exactly in the last Silver Market update posted on 15th December, as the chart below from that time makes clear...
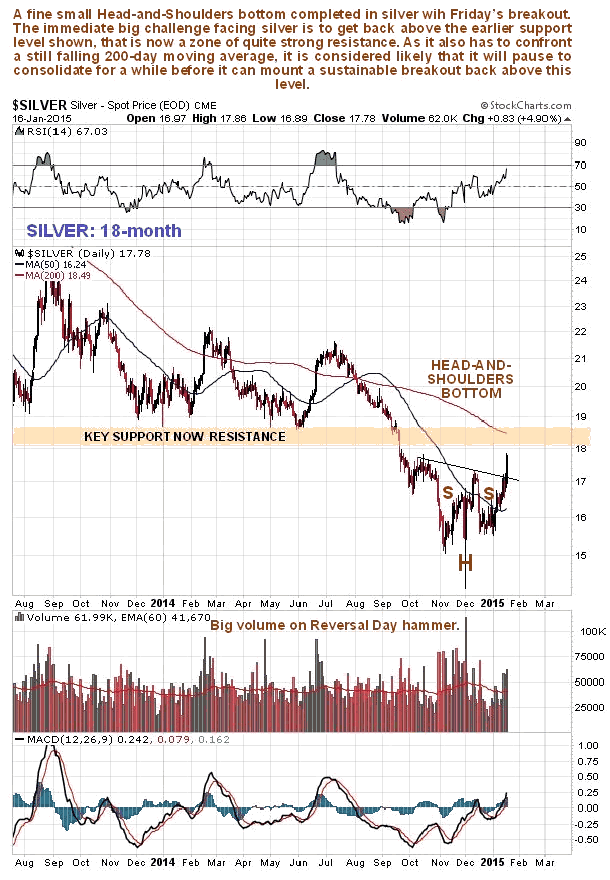
The 18-month chart is very useful as it shows that, although it has turned up, it will not be "plain sailing" for silver until it overcomes the substantial resistance between $18 and $19, where the price found support on numerous occasions in the past, and where there is also resistance from the falling 200-day moving average. Although this resistance will be a "tough nut to crack" various factors suggest that silver will succeed, and then go on to mount a vigorous advance, although it is thought likely that it will pause to consolidate or react for a while beneath this resistance before attempting to surmount it.
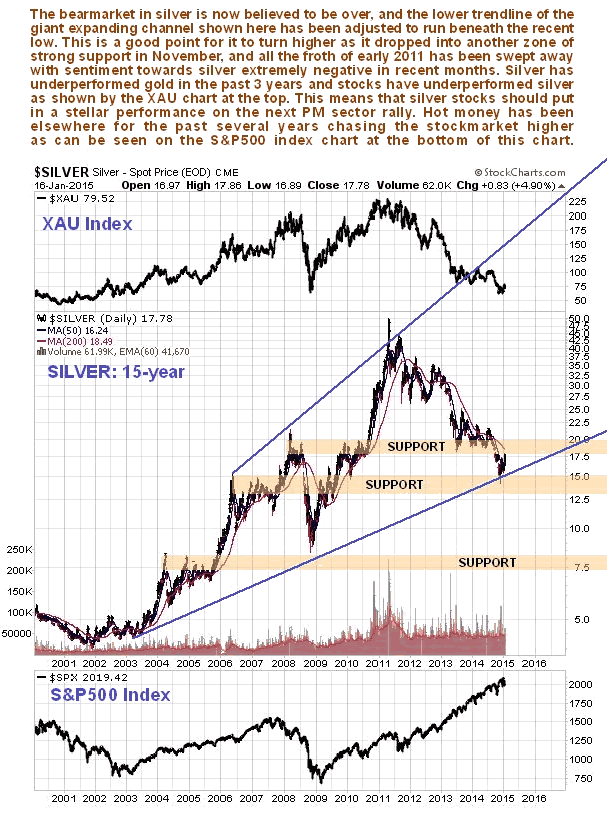
The long bearmarket in silver is now believed to be over, and the lower trendline of the giant expanding channel shown on the 15-year chart below has been adjusted somewhat to run beneath the recent low. This is an excellent point for silver to embark on a new uptrend as it has just dipped into a zone of very strong support in the $13 - $15 area, and sentiment towards it in recent months has been awful, a sign of an important bottom. With silver having seriously underperformed gold for almost 4 years, there is plenty of room for it to outperform on the next major PM sector upleg, and given that stocks have underperformed silver, as made plain by the XAU index at the top of this chart, it is clear that the best performers of all on the next sector upleg should be the better silver stocks.
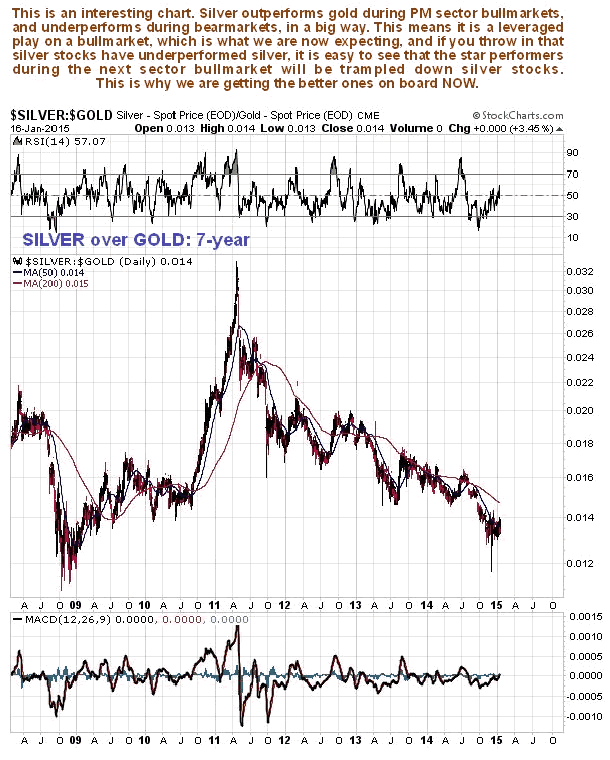
The outperformance of silver relative to gold in a sector bullmarket, and the underperformance in a sector bearmarket, are made abundantly plain in the following chart for silver relative to gold, which goes back 7 years in order to include the 2008 market crash. As we can see, after almost 4 years of underperforming, it is not unreasonable to look forward to a long period of outperformance before much longer.
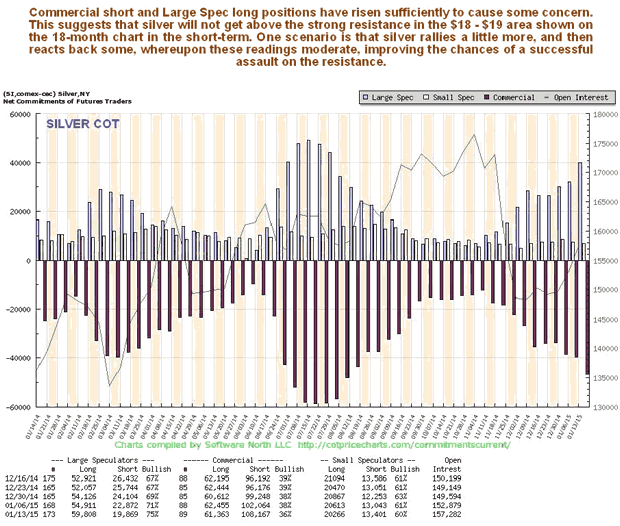
The silver hedgers chart, which is a form of COT chart over a much longer timeframe, shows positions changing and moving through middling ground to somewhat bearish. This suggests that the current rally will stall out at or a little below the strong resistance in the $18 - $19 area, and a reaction set in, before silver regroups and later surmounts this obstacle.
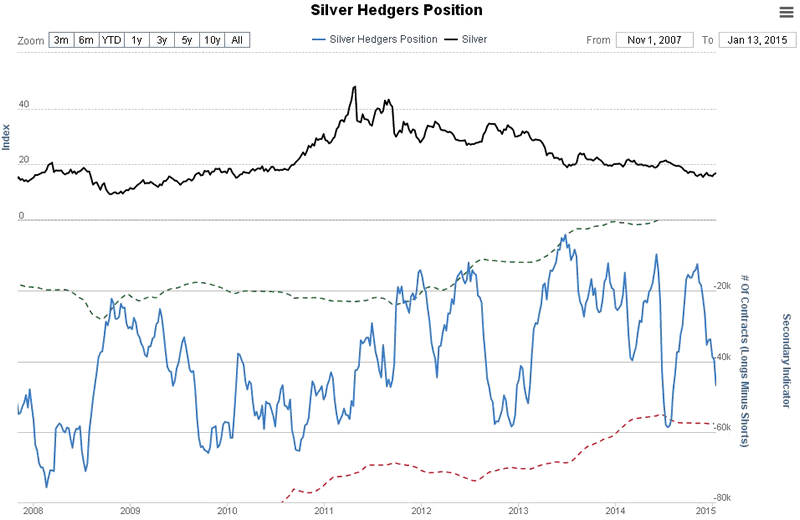
Chart courtesy of www.sentimentrader.com
The silver optix, or optimism index, which has climbed from strongly bullish readings into neutral territory, also suggests such a scenario, a rally towards or into the $18 - $19 area, then a reaction.
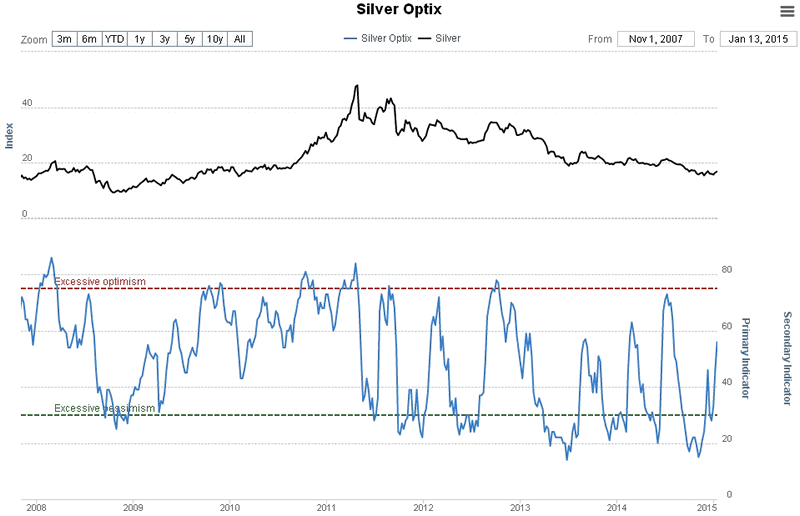
Chart courtesy of www.sentimentrader.com
As usual, much of what is written in the Gold Market update, especially with respect to the general economic outlook and QE, and to the dollar, applies equally to silver and is not repeated here.
By Clive Maund
CliveMaund.com
For billing & subscription questions: subscriptions@clivemaund.com
© 2015 Clive Maund - The above represents the opinion and analysis of Mr. Maund, based on data available to him, at the time of writing. Mr. Maunds opinions are his own, and are not a recommendation or an offer to buy or sell securities. No responsibility can be accepted for losses that may result as a consequence of trading on the basis of this analysis.
Mr. Maund is an independent analyst who receives no compensation of any kind from any groups, individuals or corporations mentioned in his reports. As trading and investing in any financial markets may involve serious risk of loss, Mr. Maund recommends that you consult with a qualified investment advisor, one licensed by appropriate regulatory agencies in your legal jurisdiction and do your own due diligence and research when making any kind of a transaction with financial ramifications.
Clive Maund Archive |
© 2005-2022 http://www.MarketOracle.co.uk - The Market Oracle is a FREE Daily Financial Markets Analysis & Forecasting online publication.


