Gold Price Rally Has Technical and Fundamental Support
Commodities / Gold and Silver 2015 Jan 17, 2015 - 10:49 AM GMTBy: Sy_Harding
 Gold plunged 48% from its record high above $1,900 an ounce in 2011, to its low late last year. That was a sizable bear market move.
Shorter-term, it was one of last year’s worst performers, down 15% for the year.
In a recent column, I noted how at year-end, investors looking for the next year’s winners tend to look for them on lists of last year’s ‘Top 25 stocks’ or ‘Top 25 mutual funds’. However, studies show they would be better off shopping among the previous year’s losers. (The previous year’s winners are more liable to already be overbought and over-valued, while the losers are more likely to be oversold and on the bargain table).
As one of last year’s big losers gold seems to qualify on that metric anyway.
However, what are the fundamentals and technical analysis saying about it.
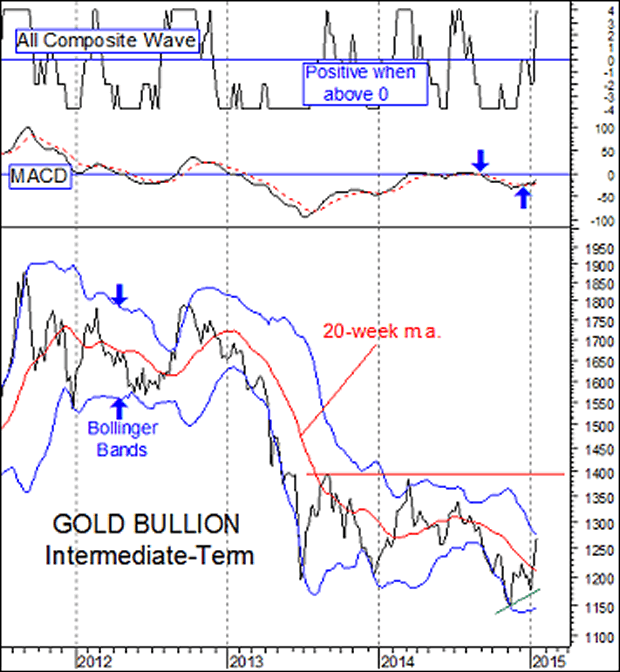
Let’s begin with the intermediate-term technical chart.
Rallying from a rising double-bottom (a higher low), gold has broken out above its 20-week moving average into the usually bullish upper half of Bollinger Bands. And the buy signals that began with the short-term indicators on short-term charts, have now spread to the intermediate-term indicators, two of which are shown in the chart.
So the technical outlook is improving as the rally continues.

On the fundamentals, gold is traditionally a safe haven in times of global currency uncertainties. We certainly have seen those in recent months.
As the U.S. dollar soars, the euro and other global currencies plunge. As global economies slow and inflation declines, gone are the long-forgotten promises of central banks in 2009 of continuing coordinated actions. It seems to have become every country for itself.
Central banks in Brazil, Russia, Ukraine, Nigeria, and others have raised interest rates. Central banks in China and India have cut rates. The U.S. Fed has ended its QE stimulus program, and is contemplating when it should begin to raise rates. The European Central Bank (ECB) is widely expected to cut rates and launch a substantial QE stimulus program at its meeting next week.
That was enough uncertainties to support gold beginning to rally off its November low.
Those uncertainties became alarming with this week’s surprise move by Switzerland’s central bank to abruptly end its long-standing and long-defended cap on its currency.
With the unexpected lifting of that restraint (no forewarning), the Swiss franc surged up in value. Switzerland’s stock market plunged. The fallout rocketed around the world, hammering global banks, currency trading firms, and foreign exchange (FX) investors with large losses. It has already triggered the collapse of some smaller FX brokerage firms, and raised fears of the turmoil spreading to other areas.
So gold’s rally seems to be supported by both a technical breakout and the fundamentals.
For the moment, it should be considered a promising intermediate-term rally, but not necessarily the end of gold’s bear market. That will be determined by how it handles resistance in the area of $1,400 an ounce, where its last two intermediate-term rallies topped out.
In the interest of full disclosure, my subscribers and I have positions in the SPDR Trust Gold etf, symbol GLD, and in gold mining stocks.
Sy Harding is president of Asset Management Research Corp., and editor of the free market blog Street Smart Post.
© 2014 Copyright Sy Harding- All Rights Reserved
Disclaimer: The above is a matter of opinion provided for general information purposes only and is not intended as investment advice. Information and analysis above are derived from sources and utilising methods believed to be reliable, but we cannot accept responsibility for any losses you may incur as a result of this analysis. Individuals should consult with their personal financial advisors.
Sy Harding Archive |
© 2005-2022 http://www.MarketOracle.co.uk - The Market Oracle is a FREE Daily Financial Markets Analysis & Forecasting online publication.


