


Another 15% Drop in Copper Price?
Commodities / Gold and Silver 2015 Jan 14, 2015 - 06:05 PM GMTBy: Ashraf_Laidi

Today's 4.3% slump in copper is the ninth consecutive daily decline in the metal, a pattern last seen 11 months ago during the peak of China's financing shenanigans -- when Chinese companies used the metal as collateral to access cheap-USD financing and invest the proceeds in higher yielding Chinese yuan.
Since the start of 2014, copper is down 20, outperforming energy commodities (Brent -56%, WTI -49%, NatGas -29%) and underperforming metals (gold +2.0%, silver -14%). The striking difference between now and Q1 2104 is that copper is now joined by the much feared converging decline along the rest of metals, energy and agricultural commodities. The extent of copper's damage is highlighted by more than just unwinding in Chinese trade financing.
The slowdown in China's macro dynamics has broadened throughout the credit and wholesale factory chains as the prolonged deflation in producer prices and 4 1/2-year lows in consumer prices carries red flags for Chinese imports as the wholesale price contraction makes its way into the consumer price level. Copper's overnight damage was attributed to the World Bank's downgrade of 2015 world growth to 3.0% from 3.4%, but we consider Tuesday's release of Chinese trade data showing the 6th monthly decline in imports over the last 10 months, as the greater catalyst - even if the report was overshadowed by rising (and irrelevant) exports.
Another 15% decline?
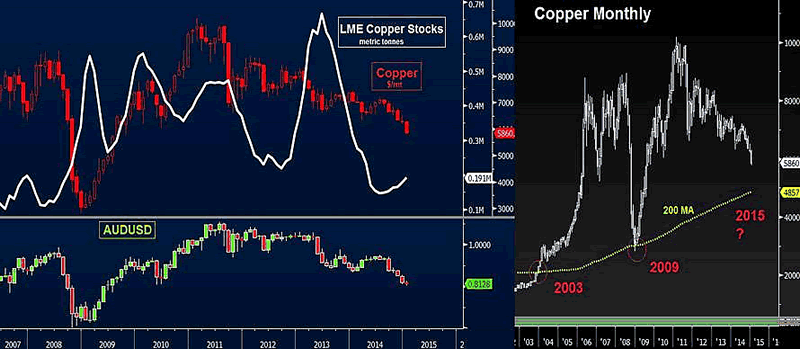
The charts below show the sixth weekly increase in copper warehouse inventories at the London Metals Exchange (longest rise since March-April 2013) and the persistent positive correlation between copper prices and the AUDUSD exchange rate. If copper sticks to its historical trend-reversion and reaches its 200-month moving average as has been the case in each 6 years, then another 15% decline towards $4855 is a possibility for 2015. This becomes even more plausible when consider that copper inventories are up only 33% from their 2014 lows (compared to 220% in early 2013 and 118% in 2010, both periods when China's economy grew stronger than today).
Best
For more frequent FX & Commodity calls & analysis, follow me on Twitter Twitter.com/alaidi
By Ashraf Laidi
AshrafLaidi.com
Ashraf Laidi CEO of Intermarket Strategy and is the author of "Currency Trading and Intermarket Analysis: How to Profit from the Shifting Currents in Global Markets" Wiley Trading.
This publication is intended to be used for information purposes only and does not constitute investment advice.
Copyright © 2015 Ashraf Laidi
Ashraf Laidi Archive |
© 2005-2022 http://www.MarketOracle.co.uk - The Market Oracle is a FREE Daily Financial Markets Analysis & Forecasting online publication.