What’s In Store For Gold Price in 2015?
Commodities / Gold and Silver 2015 Jan 11, 2015 - 03:12 PM GMTBy: Jason_Hamlin
 The following article is from Gold Stock Bull contributor, Ben Kramer-Miller. While I agree with his overall assessment and reasoning, I am a bit more bullish in the short term and think precious metals have likely already found a bottom. Of course, short-term pricing is driven by paper derivative contracts and the emotions of investors that either panic or buy the dip when the sharp price movements occur, so anything is possible in the short term. In the medium to long-term, we both agree that prices for both gold and silver are moving substantially higher and that 2015 will prove to be an excellent year to accumulate metals and undervalued miners. Cheers – Jason Hamlin
Overview
After a lousy 2013 gold was essentially flat in 2014. The London AM fix on December 31st came in at $1,199.25 in 2014 vs. $1,201.50 for 2013.
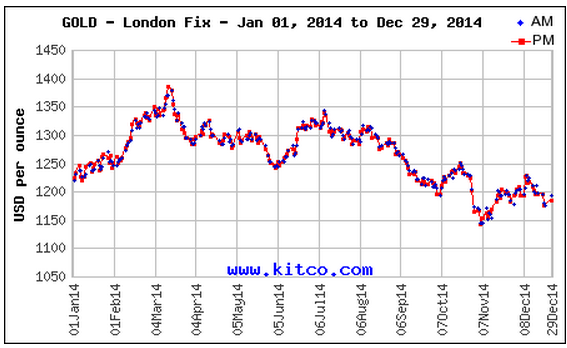
The year started out strong and many gold bulls called the end of the downtrend. However a strengthening US Dollar, signs of economic growth in the US, and concerns over the Fed’s tapering program put an end to the bull market pretty early in the year when gold peaked in March at ~$1,370/oz.
These signs, among others (which I will discuss in a moment), prompted me to call for more downside in the gold market in September when the price was hovering around $1,300/oz. Shortly thereafter the gold price fell below its critical support level of ~$1,180/oz. and traded down to ~$1,135/oz. before rebounding back to today’s range, which is roughly $1,180 – $1,220/oz.
So where do we go from here?
As a gold bull I want to believe that gold is going to start moving higher from here, but unfortunately I think the odds remain stacked against this, and that we will see further downside before the bull market resumes. I will first go through the reasons why I think this is the case and I will then discuss how to play this.
Why Gold Probably Has More Downside
Again I discussed some of the reasons I think gold has more downside in the near term in September. It is worth repeating/updating a couple of these reasons, and I also want to bring a couple others into the mix.
1-Gold Didn’t Test Its 2009 Breakout Point
Gold has experienced two significant corrections since the bull market began at the turn of the century. The first was in 2008 and the second began in 2011. One thing that differs between the two besides their durations is that when the market bottomed in 2008 it hit a major support level of ~$700/oz. This level is technically significant because it had previously been resistance from April, 2006 through August, 2007. But we have not seen gold test its previous breakout point in this downtrend. The last breakout point was the resistance level of ~$1,000/oz., which is where the market peaked in 2008. The breakout led to the subsequent rally all the way to ~$1,900/oz. in 2011. Now if the pattern were going to repeat the gold market should test the $1,000/oz. level, but as you can see on the following 10-year chart of the SPDR Gold Trust (NYSEARCA:GLD) we haven’t seen this.
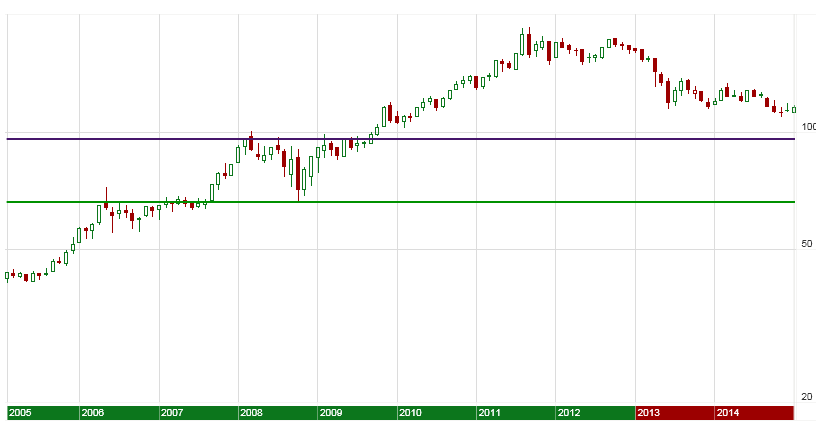
Technical analysts would argue that a test or even a quick breach of the $1,000/oz. level (or ~$95/share for the GLD) would wipe out the speculative money that entered the market after the gold price broke to its new all-time high, and that this would be needed in order to set the stage for a fundamentally driven leg higher.
2-Stocks and Bonds Remain In Favor
Broadly speaking I am not bullish of stocks, and I am downright bearish of bonds. But there is no denying that these assets have been performing well over the short and intermediate term. While the mainstream financial press would have you believe that these assets trade opposite to one another they are historically correlated, and pertinent to this discussion they are negatively correlated to gold.
Stocks and bonds are both financial assets, meaning that they are claims against another entity that owes something to the stock or bond holder (e.g. dividends or interest payments). Despite the fact that stocks and bonds are richly valued on an historic basis investors don’t seem to care. Easy credit from the Fed makes these low returns appealing on a relative basis, and this puts pressure on assets whose value is intrinsic such as gold and other commodities.
At least in the near term bonds will remain expensive because central banks will see to it that interest rates remain low, and stocks respond to this as low bond yields make stock dividend and earnings yields more attractive by comparison.
With financial assets in favor real assets are, by extension, out of favor. Commodities in general–not just gold and precious metals–have been weak with very few exceptions.
Now financial assets are, broadly speaking, overvalued while commodities are generally undervalued, and this includes gold. But the market is not at a point where these disparities really matter. So long as money remains cheap bond prices can rise and anything that has a yield can rise with them. At some point this situation will reverse itself, but for now it suffices to say that it makes sense to yield to Newton’s first law of motion, and acknowledge that financial assets will keep rising while tangible assets will keep falling until something happens to reverse this trend.
3-Federal Reserve Tapering and Rising Interest Rates Are Perceived To Be Bearish for Gold
This follows from the misconception that I just discussed. Many investors are concerned that the Fed has stopped pumping money into the market via its QE program, and that this is bearish for gold. The intuition is that there will be less money in the financial system to bid up gold prices.
The fact is that if the Fed raises rates there may very well be less money in the system. And this perception has the potential to drive some naive investors out of the gold market and some speculators to short the market.
We’ve seen, however, that this is misguided and we will shortly see just how misguided this actually is.
4-The Dollar Index Has Been Strengthening
One of the big surprises this year has been the strength in the Dollar Index, as you can see on the following chart. courtesy of Barchart.com.
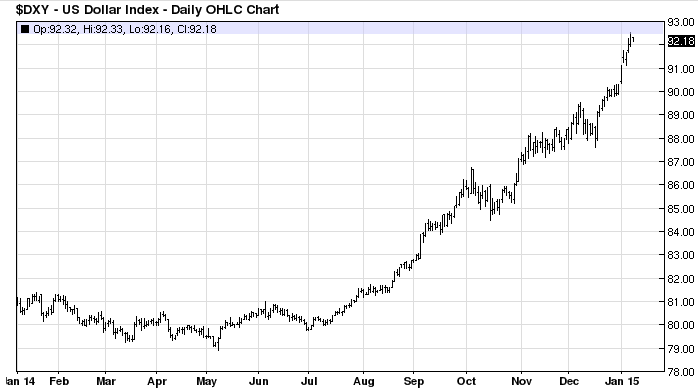
This strength has led investors to believe that the Dollar itself is strong, and it leads investors to avoid investments in gold and in other commodities.
Now gold bulls know that Dollar Index strength is not the same thing as Dollar strength. The former simply means that the Dollar is increasing in value relative to a basket of currencies that includes the Euro, the Yen, the Pound, and others. But this doesn’t mean the Dollar itself is strong. For instance, the Dollar Index has gained about 15% since its 2008 low, but the Dollar has lost about a fifth of its value relative to gold.
Nevertheless in the short run this perception can trump reality, and a rising Dollar Index can be short-term bearish for gold.
The Bullish Perspective: Rising Rates Will Send Gold Soaring
A novice view of the phenomena just discussed paints a very bearish picture for the gold market.
But a deeper analysis of these phenomena–particularly the second and the third–paints an extremely bullish picture.
We saw earlier that QE and ZIRP has created demand for bonds and stocks because even their paltry interest rates are attractive in the context of very low interest rates available on cash/equivalents while there is more money in the financial system to bid these assets higher. This takes away money from the gold market which doesn’t generate any income.
While this line of reasoning makes sense unto itself I think a lot of investors are confused in the sense that quantitative easing and ZIRP (i.e. zero interest rate policy) have not pushed gold higher. Shouldn’t a rising money supply have precisely this effect?
In spite of this intuition the above line of reasoning holds and historically the gold price has performed best when the Fed’s benchmark rate has been trending upward. I discussed this at length in another article and I have imported the following chart for the reader’s convenience.
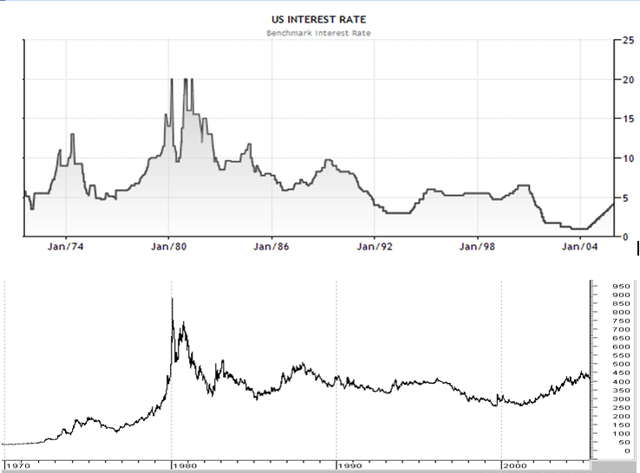
Investors who don’t understand the logic behind the obvious correlation here should think of it as follows. Low interest rates and a rising money supply are bullish for gold in the same way that pushing a beach ball under water is “bullish” for the beach ball in the sense that when the pressure is lifted the beach ball will fly higher than it would have otherwise. To put it another way low interest rates are bullish for gold in that they give it potential energy, but kinetic energy will send it higher, and it will take rising rates to convert this kinetic energy into potential energy.
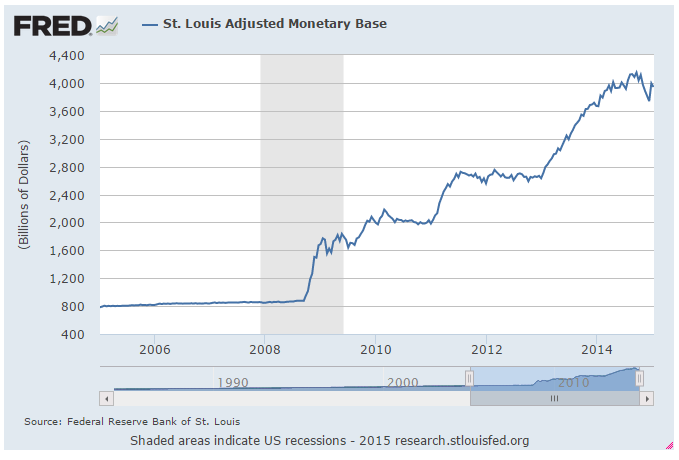
With that being said gold I think it is important to point out that gold is being infused with an unprecedented amount of “potential energy” in the sense that never in this history of the Federal Reserve has the monetary base risen so rapidly. We can see in the following chart that the monetary base has risen 5-fold (17% per year) in the past 10 years.
Gold doesn’t necessarily trade with the monetary base but we can use it to get a good idea of gold’s relative valuation by looking at the value of America’s gold relative to it.
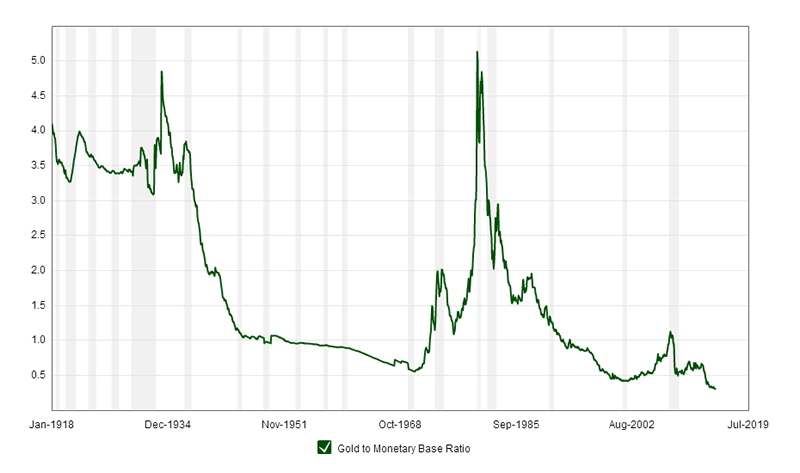
We can see that using this metric not only is gold undervalued, but it is more undervalued than it has been since 1918, which is as far back as the Fed’s monetary base data goes. We can also see that in spite of the fact that the gold market traded to a nominal record high in 2011 that it has–from at least one perspective–been in a bear market for the past 35 years.
What Will Signal The Turnaround?
So gold is incredibly undervalued and is perhaps in a multi-decade long bear market. Why should the downtrend end anytime soon, and what should we look for as a signal that the bear market is actually coming to an end?
We’ve already seen the answer to this above–rising rates. The Fed has signaled that it will raise its benchmark interest rate starting this year for the first time since 2008, and we’ve seen that this will make bonds and stocks less attractive on a relative basis, and some of this “excess” money will find its way into gold.
So one scenario is that the Fed increases rates, the gold market has a knee-jerk reaction to a new low as pundits ramble on about how negative this is for gold, and then the market reverses sharply from its new low and begins a new uptrend.
There is a problem with this scenario, however. Every time the Fed has removed stimulus from the market the stock market has fallen and it begins a new “panic,” which in turn gives the Fed an excuse to continue with more stimulus.
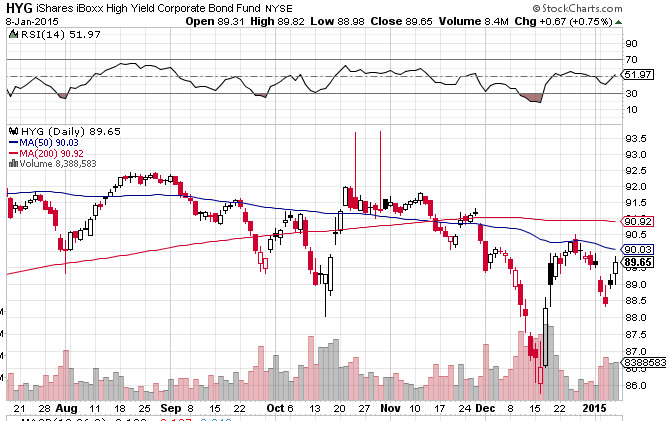
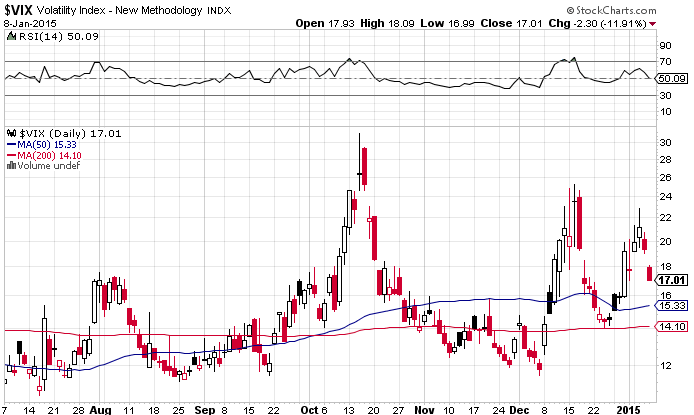
I think we can still see gold rise in this scenario because interest rates can only go so low and bond/stock yields can only go so low as well. Already bond and stock yields are at historic lows, and while the can go lower eventually their overvaluations will get the best of them and we can see money enter the gold market. One might argue that we may already be on the verge of this given some signs such as the downturn in junk bonds (see the following chart of the iShares High Yield Debt ETF (NYSEARCA:HYG) and the uptrend we’ve seen in volatility. Both charts are courtesy of Stockcharts.
But in this case what sort of signal should we look for? that the gold market has turned?
In this scenario I think investors should look at Gold Forward Offered Rates (GOFO). This is the rate at which bullion banks lend gold. The lower the rate the more desirable it is for banks to hold gold.
But what specifically should we look for, and how does this tie in with the current scenario?
A lot of investors suggested recently that the fact that the GOFO rate went negative towards the end of 2014 that the gold market had likely bottomed. I think this is misleading considering the current low interest rate environment that we are experiencing, and this point is supported by the fact that GOFO went negative in 2013 and this didn’t signal a bottom in the gold market.
What we need to see, therefore, is for bullion banks to value gold substantially more than they value interest-bearing paper assets, and so I think the signal to look for will be relative GOFO rates. This is a data point that is measured via LIBOR minus GOFO. If this rises substantially it means that investment banks would much rather hold gold than interest bearing assets as short term interest bearing assets are correlated at least in part to LIBOR rates.
When we back-test this thesis we can see that spikes in 1-month LIBOR minus GOFO have been predictive of new uptrends in the gold price.
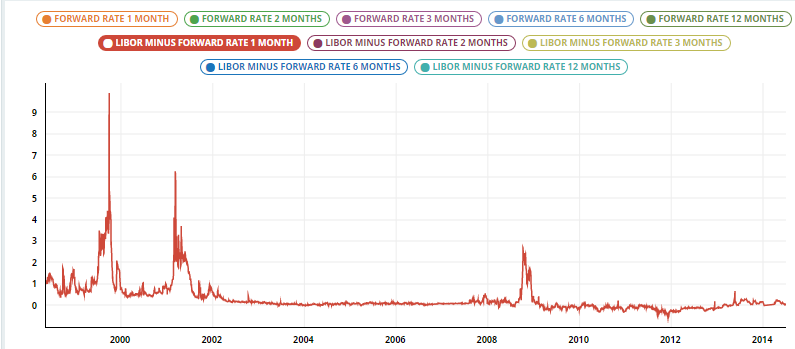
Each major spike has corresponded with a buy signal in the gold market. Now if we zoom in on the past couple of years we can see some mini-spikes, but nothing resembling the 1999, 2001, and 2008 spikes pictured above.
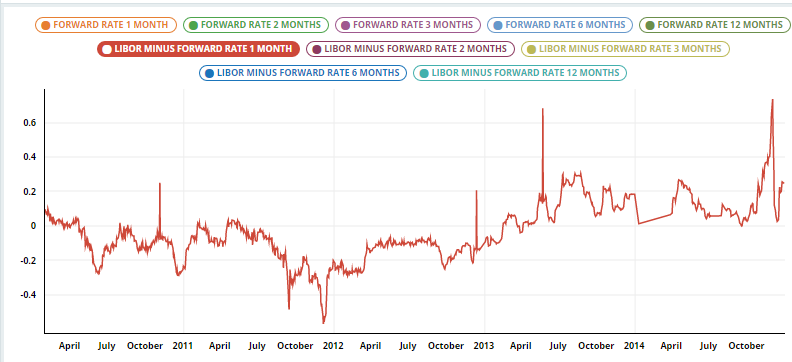
While we saw a mini-spike in the summer of 2013 as a near-term buy signal we haven’t yet seen the massive spike that marked the turn of the market.
Thus when we see a substantial spike in LIBOR minus GOFO this will signal that the relative valuation of stocks and bonds vis-a-vis cash/equivalents is insufficient to keep money out of gold in lieu of the former, and we will likely see the gold price rise again.
What Should You Do Now?
Investors are faced with a difficult decision. On the one hand we’ve seen that there are numerous signs that we can see continued weakness in gold. On the other hand gold is historically incredibly inexpensive–perhaps as inexpensive as it has been in at least a century–and from a risk/reward standpoint it makes sense to buy gold now.
The downside to buying more gold now is that we can see another 20% downside or so, and even if this downside is short-lived it will be painful, and it will test your conviction.
But at the same time the bearish signals I pointed to are misguided and/or fleeting, and they may not send gold lower. In that case the lost upside far outweighs the downside.
So what should you do?
First, you should dollar cost average. Take a bit of money from every paycheck and buy some gold, or if you have a larger chunk of money you want to invest divide it into several traunches and invest each traunch at a given interval, be it every month or twice a month, or whatever you are comfortable with. This way if I am right about gold going lower you could end up buying at an average price that is lower than today’s. If I’m wrong then you’ve bought something at today’s lower price and still get exposure to the upside.
Second, look through some of the mining and gold streaming/royalty companies and note those that are generating investor interest. While gold may not have bottomed several of these stocks have and are under accumulation. Gold stocks that are substantially off their lows or even near 52-week or even all-time highs are probably being accumulated for a reason. Furthermore there are plenty of gold miners out there that can easily make money at much lower gold prices and so if the gold price falls they won’t be in danger of losing money. Gold miners aren’t for everybody and they come with certain risks that aren’t appropriate for many investors, but the best gold miners will substantially outperform the gold price.
Conclusion
Whichever strategy you choose there is going to be volatility in the gold market that will test your conviction, and so my final and most important piece of advice is to not let this volatility alter your convictions, and remember that in the short term markets are a voting machine and in the long term they are a weighing machine. I think there’s a good chance that gold will go lower in the near term but that we will see a reversal by the end of 2015, but this opinion hardly reflects my strong conviction that the gold price is going substantially higher in the long term.
With that being said, 2015 should be an excellent year in which to accumulate gold.
Sign up for our FREE email alerts here
Get the premium newsletter, model portfolio and trade alerts here
By Jason Hamlin
Jason Hamlin is the founder of Gold Stock Bull and publishes a monthly contrarian newsletter that contains in-depth research into the markets with a focus on finding undervalued gold and silver mining companies. The Premium Membership includes the newsletter, real-time access to the model portfolio and email trade alerts whenever Jason is buying or selling. You can try it for just $35/month by clicking here.
Copyright © 2014 Gold Stock Bull - All Rights Reserved
All ideas, opinions, and/or forecasts, expressed or implied herein, are for informational purposes only and should not be construed as a recommendation to invest, trade, and/or speculate in the markets. Any investments, trades, and/or speculations made in light of the ideas, opinions, and/or forecasts, expressed or implied herein, are committed at your own risk, financial or otherwise. The information on this site has been prepared without regard to any particular investor’s investment objectives, financial situation, and needs. Accordingly, investors should not act on any information on this site without obtaining specific advice from their financial advisor. Past performance is no guarantee of future results.
© 2005-2022 http://www.MarketOracle.co.uk - The Market Oracle is a FREE Daily Financial Markets Analysis & Forecasting online publication.


