Stock Market Analysis - A Major Crash...or a Major Bottom?
Stock-Markets / US Stock Markets Mar 09, 2007 - 12:26 AM GMTBy: Clif_Droke
On Tuesday, Feb. 27, the stock market experienced its biggest 1-day tumble since 2001. That it created quite an impression on the minds of millions of investors is undisputed. What is disputed, though, is whether this sharp decline represented a needed correction of an ongoing intermediate-term bull market...or perhaps the start of a major bear market?
The debate continues with everyone having a different take on the matter. But the market itself is giving clear and decisive readings as to which side of the argument is likely correct.
Those signals suggest that the intermediate-term bull market remains intact and a short-term bottoming process is now underway. Market internals are very strong right now and have shown great improvement since last week's panic selling. Last week's sell-off was strictly an event-driven panic with no basis on the market's underlying fundamentals. It was mainly a reaction to bearish statements made by Cheng Siwei, Vice Chairman of China's highest legislative body, and by former Fed Chairman Alan Greenspan. As we've seen in the past, reaction-driven panics can be painful and scary but rarely last very long. The uptrend should eventually resume although a further period of consolidation and base building may be required.
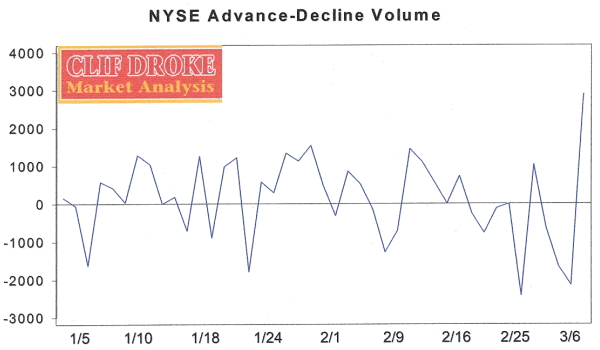
On Tuesday, Mar. 6, the ratio of buying volume to selling volume on the NYSE was 2.36 billion to 166 million, one of the highest up-to-down volume disparities in favor of buyers we've seen in a long time. That's a major improvement from the previous few days and qualifies as a signal that institutional buyers have returned to the market. This means we should see a complete reversal of the recent panic-driven decline with higher highs anticipated.
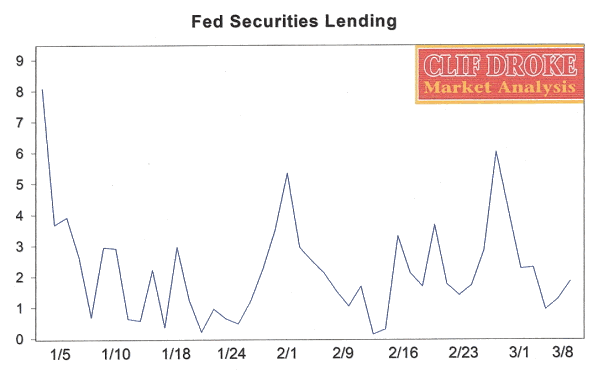
Speaking of volume, there are quite a few volume accumulation divergences showing up in the charts of the major stocks as well as the Dow 30, NASDAQ Composite and NYSE Composite charts. The volume accumulation signal is given at correction lows and usually signals the start of a relief rally on the horizon. Fed securities lending operations, which often precede NYSE volume, have also shown a positive divergence versus the major indices as you can see in the chart below.

Compare the securities lending chart above with that of the NYSE advance-decline volume chart that follows.

The latest AAII investor sentiment poll came out on Thursday, Mar. 8, and presented a picture of investors still scared over last week's decline. It showed the highest disparity in favor of the bears since Nov. 1, 2006, which marked a short-term turning point in the market from down to up. The percentage of bullish investors was reported by AAII this week at only 36%, the lowest reading since last summer. Meanwhile the bearish percentage was reported at 45%, the highest reading since last November. This is taken as a sign the market's "Wall of Worry" is still intact and is positive from a contrarian standpoint.
The main market psychology indicators are flashing major buy signals right now. Last week's panic sell-off was an event that won't soon be forgotten from Wall Street's collective minds. Judging by the market psychology indicators it has already had a profound impact on investor sentiment that is helping to cushion the market as a bottoming process begins. If history is any guide this will prove to be a major bottom and should be followed by a worthwhile advance in stock prices, which is something we'll examine in the bulk of this commentary.
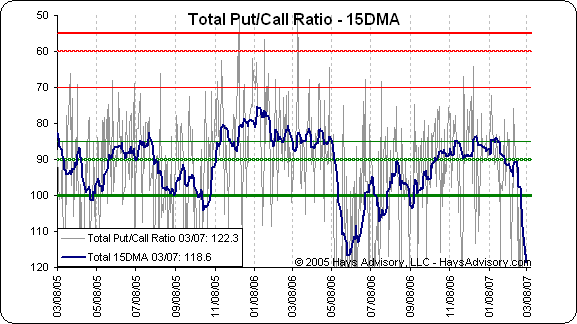
The market panic (mini-crash?) of Feb. 27 wasn't unlike many other market corrections we've seen in recent years. Let's examine the double whammy in the S&P 500 (SPX) during March-April 2005 and in late May-early June 2006 to start with. The total put/call ratio 15-day moving average hit a solidly oversold reading of about 100 around the beginning of May 2005. This coincided precisely with the final low of the vicious March-April correction of that year. After that it was off to the races for the SPX as it rallied from a low of about 1,140 to a high of 1,245 three months later.
In the fall of that same year the SPX ran into another stumbling block beginning in August, a period which coincided with one of the nastiest hurricane seasons in the U.S. in years. The SPX put in another bottom in October of that year but how did the put/call ratio behave? It hit an oversold reading of 100 in early September '05 and then hit an even higher reading of 103 in late October. This confirmed the bottom in the SPX and it was then off to the races once again with the S&P rallying from around a low of 1,170 to a high of 1,275 in just six weeks.
The S&P peaked in early May 2006 at 1,325. From there it fell to a low of 1,220 in early June. The put/call ratio fell to 100 by mid-May during the correction and then hit a super-oversold reading of 117 by early June -- the highest in its history. This represented an undisputed buy signal and after bottoming in early June 2006 at the 1,220 level the S&P proceeded to rally to a multi-year high of 1,460.
After peaking at 1,460 in February 2007, the SPX experienced a sharp decline (3 ½%) on Feb. 27 and has since fallen to a recent low of 1,375 in early March. The put/call ratio during this time fell to the same historic level it did in June 2006 and has since made a new all-time low at 118.60. This represents another strong buy signal from the standpoint of market psychology. If the put/call ratio has given a misleading signal it will be a first and therefore an historic event in itself. That isn't expected to happen, though, and put/call readings of this magnitude can be regarded as strong signals that the market is sold out with a major bottom imminent.

From a technical standpoint, past corrections have usually been 3-step affairs, i.e., a downside leg, a brief rally, then a final down leg before the final low is made. That was true for the corrections the market experienced in 2005 and 2006 and could end up being true for the current correction. However, most of the damage has already been inflicted according to the put/call ratio readings and other psychological indicators. We shouldn't have to suffer through too much more correcting before the market gets its "legs" and turns around to recover its losses.
That the put/call ratio has hit such a super "sold out" extremity may be attributed to the collective mindset of the investing public. Why is everyone breathlessly scared and panicked over a 5-7% market correction? To experience something similar to what we're now seeing you'd have to go back to the summer of 1998. At that time the global markets were being roiled, commodities were under pressure, the U.S. stock market was tanking and the yen carry trade was threatening to unwind (sound familiar)? On top of that the collapse of Long Term Capital Management was threatening to put extra pressure on everything and many were worried that the global economy would melt down.
Fast forward to 2007 and we find the same story but with a different cast of characters: the yen carry trade is threatening to unwind, the highly publicized problems of New Century Financial Corp. and the threat to the sub-prime lending market, global stock markets have been hit hard and certain commodities are under pressure. But the one thing that has remained exactly the same is that the investors are panicking and assuming an "apocalypse now!" mindset concerning the immediate future of the economy and financial markets.
In 1998 the put/call ratio hit a high of 95 following the market panic low in September of that year. This time around the markets only fell between 5-7% to date as compared with 20-22% in 1998. Yet the put/call ratio hit an all-time high of 117! The point being made here is that it takes a lot less of a market spill to panic traders and investors than it used to. Some of this can undoubtedly be attributed to the growth in financial instruments and hedge fund activity but the public fear factor is still the same and is still the dominant component in the Total Put/Call Ratio.
The other major factor that separates the 1998 crash experience from the recent tumble is market fundamentals. In 1998 the IBES Valuation model used to determine whether the U.S. stock market is over- or under-valued went from over-valued in early '98 to slightly undervalued (by about 10%) at the panic low in September '98. From there it climbed back to over-valued on the huge rally that followed the '98 market panic.
Today the IBES Valuation model shows stocks to be 35% under-valued which is near an all-time low. As Don Hayes often points out, this is a major "shock absorber" for the stock market that should act to keep the equities market from experiencing a major crash on the magnitude of the ones we saw in 1987 or even 1998.
Also worth mentioning is the spread between the earnings yield on the S&P 500 and the 10-year Treasury yield. In 1998 the spread was extremely narrow and at one point during the year favored bonds over stocks. Today, however, the S&P earnings yield is nearly 7% compared with a Treasury yield of 4.52%. That definitely favors stocks over bonds from an investment standpoint. The differential between the two yields hasn't been this high in years and it should also act as a fundamental "shock absorber" for the stock market during tumultuous times such as last week's panic selling.
Here's something else worth pondering: When Alan Greenspan was appointed by President Regan to head the Federal Reserve in 1987 the infamous stock market crash of October '87 happened just a few weeks later. This was the first major test of Greenspan's resolve and ingenuity in handling a potentially catastrophic situation and he passed the test. Ben Bernanke was appointed as Greenspan's successor to the Fed chairmanship earlier this year and, like Greenspan before him, he's already been dealt a hard blow by the stock market to test his resolve. By opening up the money supply and lowering interest rates he can pass his first major test, too.
Along those lines, I recently read some interesting comments by Adrian Van Eck that are worth repeating. He was discussing the threat of global deflation, as opposed to inflation that many suppose to be the case. He pointed out that with economic growth well above 3.0 percent in the U.S. and accelerating, many on Wall Street have been forecasting the Fed will be forced to raise rates again, possibly as high as 6.0 percent. He responds: "I have a question for them: Why would the Fed need to do that or even want to raise rates? To try and slow down an economy that is now helping stabilize housing demand and prices? That would be foolish and even stupid. To slow down an economy that is generating far more tax revenue with low rates than anyone expected? That would be stupid too." Point well taken. The Fed is likely not only to NOT raise rates but should eventually lower them. When/if they do it will trigger a further expansion of the economy and help the bull market along even more.
By Clif Droke
www.clifdroke.com
Copyright ©2002-2007
Clif Droke - Publishing Concepts
Clif Droke is editor of the 3-times weekly Momentum Strategies Report which covers U.S. equities and forecasts individual stocks, short- and intermediate-term, using unique proprietary analytical methods and securities lending analysis. He is also the author of numerous books, including most recently "Turnaround Trading & Investing." For more information visit www.clifdroke.com
© 2005-2022 http://www.MarketOracle.co.uk - The Market Oracle is a FREE Daily Financial Markets Analysis & Forecasting online publication.


