


More Washington DC Lies on Debts and Spending
Interest-Rates / US Debt Dec 09, 2014 - 03:38 PM GMTBy: MISES

 Mark Brandly writes: ”Recently, the Treasury Department secretary asserted that “The President’s policies and a strengthening U.S. economy have resulted in a reduction of the U.S. budget deficit of approximately two-thirds — the fastest sustained deficit reduction since World War II.” And, “the deficit in FY 20141 fell to $483 billion.”
Many people fell for this claim, including Nobel prize winning economist Paul Krugman. “So you heard it here first: while you weren’t looking, and the deficit scolds were doing their scolding, the deficit problem (such as it was) was being mostly solved.”
Federal Borrowing Continues
Apparently Krugman failed to read the rest of the Treasury report. Page one of this same report clarifies the issue, saying “the increase in borrowing included $483 billion in borrowing to finance the deficit and $314 billion in borrowing related to other transactions.” “Total federal borrowing from the public increased by $798 billion.” The Treasury Department’s own numbers tell us that widely reported deficit number is a lie.
This $798 billion deficit is a more accurate deficit number for FY 2014. According to the Treasury Department’s report on Public Debt to the Penny, the fiscal year 2014 debt increased $1,085.9 billion. This, however, includes the increase in intragovernmental debt of $277.2 billion. So the annual debt to the public increased by $808.7 billion. While there is a minor difference in these numbers, we can agree that the annual deficit was about $800 billion, not $483 billion.
What Is Intragovernmental Debt?
One accurate fact about the Treasury secretary’s statement is that he ignores intragovernmental debt. The federal government currently has over $5 trillion of intragovernmental debt. The feds, over the years, have collected $5 trillion in taxes and then spent this tax revenue. However, before they spent this money, they loaned it to themselves. They count the money they lent to themselves as intragovernmental debt. Only governments believe that loaning yourself money is legitimate debt. The Treasury Department’s recent statement justifiably ignores this bookkeeping deception.
The $808.7 billion debt increase is a 6.7 percent one year increase in the debt. It’s an average of $2.2 billion of additional debt per day or $92 million of borrowing for every hour of the year. This equates to around $2500 of debt per capita, about $10,000 of additional debt for the average family of four.
The Burden of Debt Remains Huge
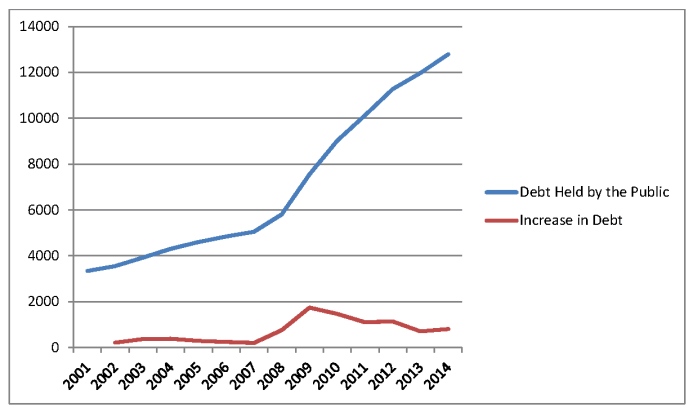
The past two administrations have a history of record deficits. According to the Treasury Department, during George W. Bush’s term, the debt held by the public, again I’m ignoring the intragovernmental debt, increased from $3,339.3 billion to $7,551.9 billion.2 That’s an eight year increase of $4,212.6 billion or a 126 percent increase during the Bush years.3 For Obama’s first five years in office the debt to the public increased to $12,785 billion. That’s a five year increase of 69 percent or an average annual increase of $1,046.6 billion. This total public debt of $12,785 billion amounts to about $40,000 for every man, woman, and child in the country.The table below shows the trends for the amount of debt and the annual increase in the debt since 2001 (in $billions).
While the annual deficit has recently trended downward, a look at the 2014 budget makes it difficult to sustain the claim that the deficit problem has been solved.
The Daily Treasury Statement for September 30, 2014 provides us with details about the FY 2014 budget. The largest line item in Treasury Deposits is the Public Debt Cash Issues of $7,519.5 billion. This is the total amount of gross government borrowing for 2014. The government tends to issue short-term debt that quickly rolls over in order to save on interest payments. The federal government borrowed this $7.5 trillion in 2014 to pay bonds as they came due, to pay for the interest on those bonds, and to pay for the remaining budget deficit. While the debt increased only $800 billion, the federal government needs to find lenders that are willing to loan it at least $7.5 trillion annually. That number will jump as the debt increases in the future.
Low Interest Rates — Or Else
In order to take advantage of low interest rates, the feds are rolling over more than half of their debt annually. The problem with that strategy is that interest rates may not remain this low for long. On the spending side of the Treasury statement we see that 2014 interest payments totaled $223.3 billion. Over the last several years, as the debt has increased, interest payments have remained relatively stable. Since September 2001, the debt held by the public has increased 283 percent, yet interest payments on that debt have only increased 37 percent. That’s because interest rates have collapsed as the debt has increased.
If interest rates return to a more historically normal average, interest payments will explode. The average interest rate on the debt for September 2014 was 2 percent. Even without an increase in the debt, if the average interest rate on the debt returns to its pre-recession September 2007 level, the annual debt payment would be over $500 billion. Given the monetary policies of the past several years, interest rates could easily increase to their September 2000 averages. If that happens, the interest on the current amount of debt would be more than $700 billion.
Given the projected increases in the debt, it wouldn’t be surprising to see annual interest payments more than quadruple in the next several years. David Walker, the former head of the Government Accountability Office, concludes that by 2022 “interest payments will become the single largest expenditure” in the government’s budget.4
Entitlements Aren’t Going Away
Entitlements are the other major budget issue. For 2014, Social Security Benefits outlays were $905.8 billion. Medicare and Medicaid spending added up to $900.4 billion ($295.7 billion for Medicaid and $604.7 billion for Medicare). Payments for these entitlements are projected to dramatically increase in the coming years as the number of recipients for these programs increase due to the aging US population. A large part of the growth in the fiscal gap is due to the large projected deficits from these programs.
As seen in the table above, the budget deficit trended downward since peaking in 2009, although it slightly increased in 2014. While budget projections tell us this downward trend may continue for the next few years, the deficit problem has not been eliminated.
Interest payments and entitlement payments will soon skyrocket. The next recession will bring about more stimulus packages. Politicians will buy votes by adding new spending programs to the budget and will be reluctant to pay for their spending with additional tax revenues. We will again see record budget deficits.
Image source: public domain on wikimedia.
- 1. FY 2014 stands for Fiscal Year 2014. Note that the government’s fiscal year ended on September 30.
- 2. The eight years of Bush budgets began on September 30, 2001 and ended on September 30, 2009. Obama’s fifth budget year ended on September 30, 2014.
- 3. Admittedly, a small part of spending in the last Bush budget may be attributed to the 2009 Obama stimulus package.
- 4. See Walker’s Comeback America, p.15. Walker’s projection is based on a GAO budget simulation.Comeback America, p.15. Walker’s projection is based on a GAO budget simulation.
By Mark Brandly
Mark Brandly is a professor of economics at Ferris State University and an adjunct scholar of the Ludwig von Mises Institute. Send him mail.
© 2014 Copyright Ludwig von Mises - All Rights Reserved Disclaimer: The above is a matter of opinion provided for general information purposes only and is not intended as investment advice. Information and analysis above are derived from sources and utilising methods believed to be reliable, but we cannot accept responsibility for any losses you may incur as a result of this analysis. Individuals should consult with their personal financial advisors.
© 2005-2022 http://www.MarketOracle.co.uk - The Market Oracle is a FREE Daily Financial Markets Analysis & Forecasting online publication.