


Stock Market Technically Overbought Coupled Negative Seasonal Factors
Stock-Markets / US Stock Markets May 18, 2008 - 01:58 PM GMTBy: Mike_Burk

The good news is Most of the major indices hit multi month highs last week.
Short Term The market is over bought.
As of last Friday, the S&P mid cap index was up for the 7 consecutive days for the first time in over a year. Longer term this is a good sign, but, for the next week or so continued upward progress is likely to be limited.
The chart below covers the past year and a half showing the S&P mid cap index (MID) in red and an indicator showing the percentage of the past 7 trading days that have been up in black. Dashed vertical lines have been drawn on the 1st trading day of the month; those lines have been drawn in red on the 1st trading day of the year.
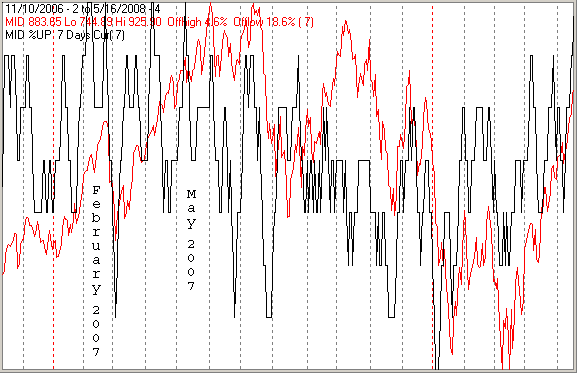
MID is the most extreme example, the Russell 2000 (R2K) was up for 4 consecutive days as of last Wednesday, the NASDAQ composite (OTC) was up for 4 on Thursday, the Russell 3000 up for 5 as of Friday and the Wilshire 5000 up for 5 as of Friday. The blue chip indices did not do as well which is a positive. Short term the market is overbought and unlikely to move significantly upward for the next few days.
Intermediate Term
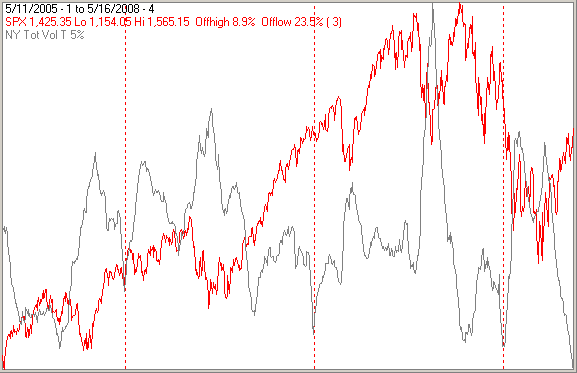
Last weeks rally failed to generate much enthusiasm as NYSE volume fell to its lowest level in over 3 years.
The chart below covers the past 3 years showing the SPX in red and a 5% trend (39 day EMA) of NYSE total volume in black. Dashed vertical lines have been drawn on the 1st trading day of each year. The indicator hit an all time high last August and a 3 year low on Friday.
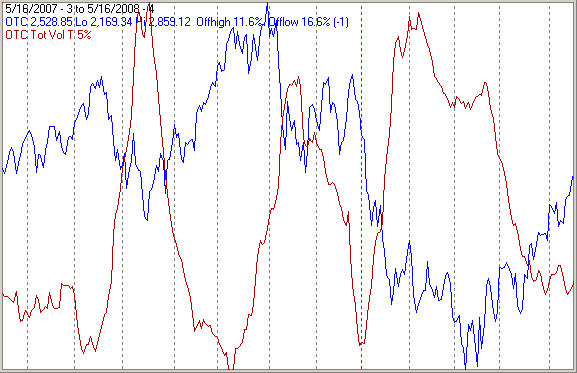
NASDAQ volume has also been weak, but not as weak as NYSE volume. The next chart covers the past year showing the OTC in blue and a 5% trend of NASDAQ total volume in brown. Relatively NASDAQ volume has not been as weak as NYSE volume, but as the chart shows there has been little improvement during the rally of the past 2 months.
Seasonality
Next week includes the 5 trading days prior to the 4th Friday in May during the 4th year of the Presidential Cycle.
The tables show the daily return on a percentage basis for the 5 trading days prior to the 4th Friday in May during the 4th year of the Presidential Cycle. NASDAQ (OTC) data covers the period from 1963 - 2007 and SPX data from 1953 - 2007. There are summaries for both the 4th year of the Presidential Cycle and all years combined. Prior to 1953 the market traded 6 days a week so that data has been ignored.
Big losses in 1984 and 2000 skew the 4th year results negatively, but even the averages for all years are slightly negative.
Report for the week before the 3rd Friday of May
The number following the year is the position in the presidential cycle.
Daily returns from Monday through 3rd Friday.
Report for the week before the 4th Friday of May
The number following the year is the position in the presidential cycle.
Daily returns from Monday through the 4th Friday.
| OTC Presidential Year 4 | ||||||
| Year | Mon | Tue | Wed | Thur | Fri | Totals |
| 1964-4 | 0.05% | -0.82% | -0.08% | 0.49% | 0.28% | -0.07% |
| 1968-4 | -0.38% | -0.22% | 0.66% | 0.56% | 0.67% | 1.29% |
| 1972-4 | 0.17% | 0.26% | 0.57% | 0.25% | 0.11% | 1.35% |
| 1976-4 | -1.39% | -0.39% | 0.33% | -0.36% | 0.30% | -1.51% |
| 1980-4 | 0.00% | -0.21% | -0.12% | 0.82% | 1.03% | 1.52% |
| 1984-4 | -0.60% | -0.97% | -0.51% | -1.75% | -0.07% | -3.89% |
| Avg | -0.55% | -0.31% | 0.19% | -0.10% | 0.41% | -0.25% |
| 1988-4 | -0.76% | 0.52% | 0.16% | 0.43% | -0.17% | 0.18% |
| 1992-4 | 0.37% | 0.26% | 0.39% | -0.21% | 0.21% | 1.02% |
| 1996-4 | 0.50% | -0.30% | 0.24% | 0.10% | -0.07% | 0.48% |
| 2000-4 | -0.77% | -5.93% | 3.35% | -1.99% | -0.01% | -5.36% |
| 2004-4 | 0.57% | 2.17% | 0.59% | 0.42% | 0.11% | 3.86% |
| Avg | -0.02% | -0.66% | 0.94% | -0.25% | 0.01% | 0.03% |
| OTC summary for Presidential Year 4 1964 - 2004 | ||||||
| Avg | -0.22% | -0.51% | 0.51% | -0.11% | 0.22% | -0.10% |
| Win% | 50% | 36% | 73% | 64% | 64% | 64% |
| OTC summary for all years 1963 - 2007 | ||||||
| Avg | -0.18% | -0.19% | 0.07% | 0.10% | 0.16% | -0.04% |
| Win% | 45% | 42% | 58% | 58% | 66% | 56% |
| SPX Presidential Year 4 | ||||||
| Year | Mon | Tue | Wed | Thur | Fri | Totals |
| 1956-4 | -0.86% | -1.59% | -0.53% | -0.93% | 0.04% | -3.87% |
| 1960-4 | -0.13% | -0.11% | -0.05% | 0.07% | 0.05% | -0.16% |
| 1964-4 | -0.47% | -0.52% | 0.45% | 0.05% | 0.04% | -0.45% |
| 1968-4 | -0.46% | 0.50% | 0.26% | -0.22% | 0.19% | 0.26% |
| 1972-4 | 0.65% | 0.08% | 0.48% | 0.14% | 0.18% | 1.53% |
| 1976-4 | -1.80% | 0.05% | -0.15% | 0.04% | 0.80% | -1.05% |
| 1980-4 | 0.30% | -0.05% | 0.09% | 1.20% | 1.48% | 3.02% |
| 1984-4 | -0.67% | -0.55% | -0.47% | -1.25% | 0.26% | -2.69% |
| Avg | -0.40% | 0.01% | 0.04% | -0.02% | 0.58% | 0.21% |
| 1988-4 | -0.87% | 1.07% | 0.10% | 0.34% | -0.48% | 0.17% |
| 1992-4 | 0.66% | 0.86% | -0.24% | -0.67% | 0.34% | 0.96% |
| 1996-4 | 0.63% | -0.06% | 0.84% | -0.36% | 0.37% | 1.43% |
| 2000-4 | -0.45% | -1.91% | 1.83% | -1.26% | -0.25% | -2.04% |
| 2004-4 | 0.17% | 1.61% | 0.17% | 0.57% | -0.05% | 2.46% |
| Avg | 0.03% | 0.31% | 0.54% | -0.27% | -0.01% | 0.60% |
| SPX summary for Presidential Year 4 1956 - 2004 | ||||||
| Avg | -0.25% | -0.05% | 0.21% | -0.18% | 0.23% | -0.03% |
| Win% | 38% | 46% | 62% | 54% | 77% | 54% |
| SPX summary for all years 1953 - 2007 | ||||||
| Avg | -0.16% | -0.13% | -0.09% | 0.02% | 0.13% | -0.22% |
| Win% | 44% | 45% | 50% | 52% | 65% | 55% |
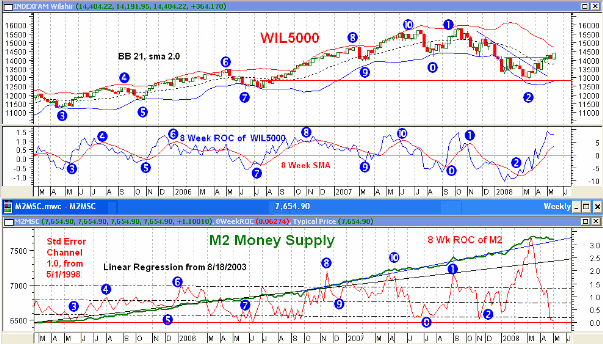
Money supply (M2)
Gordon Harms provided the money supply chart. Money supply growth is as low as it has been at any time in the last several years.
Conclusion
The market is overbought and seasonally next week has a modestly negative bias. I expect the major indices to be lower on Friday May 23 than they were on Friday May 16.
Last weeks negative forecast was a miss.
By Mike Burk
To subscribe to this report : http://alphaim.net/signup.html
Gordon Harms produces a Power Point for our local timing group. You can get a copy of that at: http://www.stockmarket-ta.com/ .
Disclaimer: Mike Burk is an employee and principal of Alpha Investment Management (Alpha) a registered investment advisor. Charts and figures presented herein are believed to be reliable but we cannot attest to their accuracy. Recent (last 10-15 yrs.) data has been supplied by CSI (csidata.com), FastTrack (fasttrack.net), Quotes Plus (qp2.com) and the Wall Street Journal (wsj.com). Historical data is from Barron's and ISI price books. The views expressed are provided for information purposes only and should not be construed in any way as investment advice. Furthermore, the opinions expressed may change without notice.
Mike Burk Archive |
© 2005-2022 http://www.MarketOracle.co.uk - The Market Oracle is a FREE Daily Financial Markets Analysis & Forecasting online publication.