


Stock Market Trend Analysis for May 2008
Stock-Markets / US Stock Markets May 08, 2008 - 05:18 PM GMTBy: Hans_Wagner

 To make money in the stock market it is important to follow the trend. It is best to begin with the big picture in mind and then work our way down to weekly and then daily views of the charts. You will notice that the chart and the value of the indicators change as we move from a monthly to a weekly and then a daily chart. This is a normal part of the technical analysis.
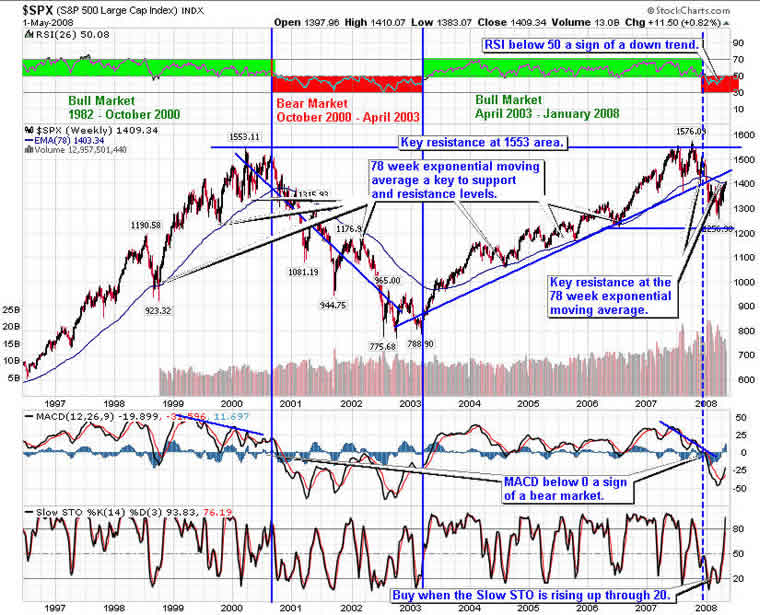
Let's start with the long term view of the S&P 500. The Relative Strength Index (RSI) seems to be a good indicator of the cyclical bull and bear markets. In addition, the 78-week Exponential Moving Average (EMA) acts as support in a bull market and resistance in a bear market.
In January, we fell into a bear market as the RSI dropped below 50. The index fell through the rising trend line and the 78-week exponential moving average and MACD crossed below zero. This is consistent with the fundamentals of a weakening economy, and a recession. It is best to remain nimble during times like this.
The first support level looks to be just above the 1200 level. We are testing the 78 week exponential moving average, which is a normal occurrence. If this resistance level holds, then it is a sign the market will fall further and you could go short.
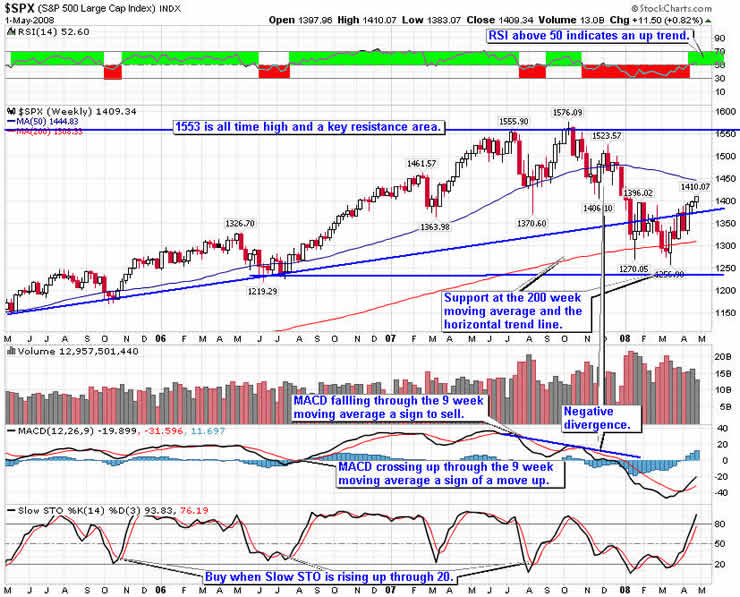
The weekly S&P 500 below was in a bullish ascending triangle that broke to the down side. It is now being retested. If the current move up can hold then look for resistance at the 50-week moving average.
Support is now at the 200-day moving average. RSI above 50 indicates an up trend. MACD rose up through the 9-week moving average, a buy sign.
As expected, we are seeing rebound to the rising trend line and possibly the 50-week moving average.
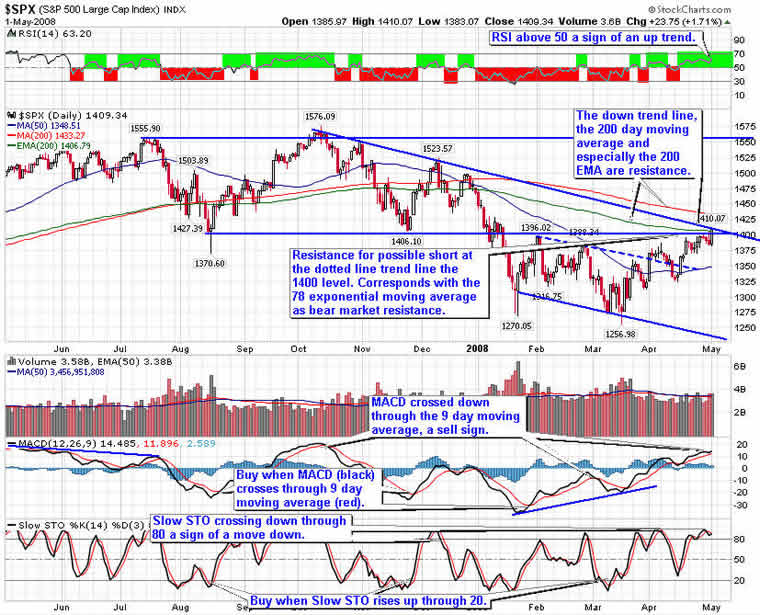
The daily S&P 500 chart below shows a declining channel. If this channel holds then I expect the market to move down to test the recent lows.
RSI is above 50 indicating an up trend. The MACD gave a buy signal indicating a move up that is continuing. The Slow Stochastics signaled a move down when it fell through 80. This indicator is often early and a bit whippy, so it is likely to move back up again.
In bear markets, it is best to be nimble and/or use risk protection such as trailing stops, protective put options and even covered call options.
Given this perspective, it is important to be patient looking for good opportunities to enter longs that are able to overcome the downward bias in the market.
I expect the market to pull back from this resistance level in May and trend down. It will be important to add down side protection to your long positions either through stops, protective put options and/or covered calls. On any rise to a key resistance level, look to go short either through selected stocks or the ultra short ETFs SDS, and QID.
To help you learn more about identifying market trends and how to play them you might find these two books of interest:
Active Value Investing : Making Money in Range-Bound Markets (Wiley Finance) by Vitaliy Katsenelson. The core of Katsenelson's strategy is to break down into three key pieces what you need to look at when analyzing a company: Quality, Valuation, and Growth (QVG).
Ahead of the Curve: A Commonsense Guide to Forecasting Business and Market Cycles by Joe Ellis is an excellent book on how to predict macro moves of the market.
By Hans Wagner
tradingonlinemarkets.com
My Name is Hans Wagner and as a long time investor, I was fortunate to retire at 55. I believe you can employ simple investment principles to find and evaluate companies before committing one's hard earned money. Recently, after my children and their friends graduated from college, I found my self helping them to learn about the stock market and investing in stocks. As a result I created a website that provides a growing set of information on many investing topics along with sample portfolios that consistently beat the market at http://www.tradingonlinemarkets.com/
Hans Wagner Archive |
© 2005-2022 http://www.MarketOracle.co.uk - The Market Oracle is a FREE Daily Financial Markets Analysis & Forecasting online publication.