


Dow Jones Bearish Wedge Time Frames Analysis- Yorba TV Show
Stock-Markets / US Stock Markets May 08, 2008 - 10:46 AM GMT

 Today I would like to talk about charting in different time frames so that
the trader may get a different persspective on the market he or she is
trading.
Today I would like to talk about charting in different time frames so that
the trader may get a different persspective on the market he or she is
trading.
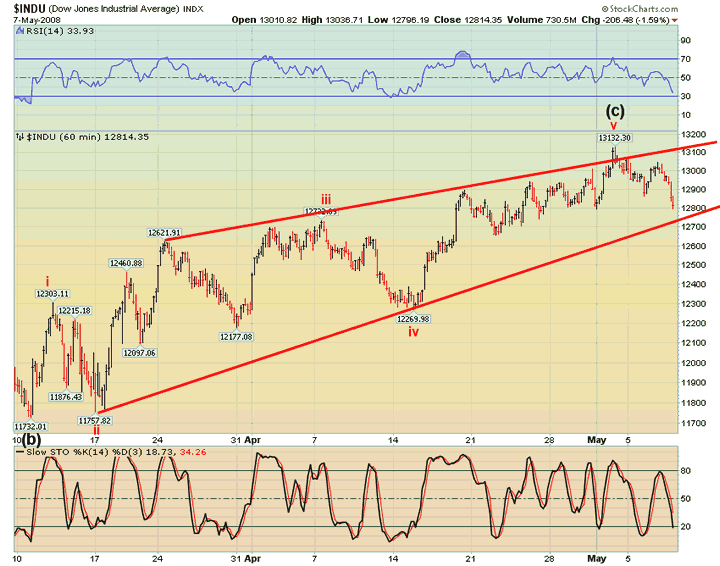
The first picture is an hourly chart on the Dow Jones Industrials. On the far right it shows the reversal we had in the last week. Remember I had said that the markets were in a topping process and you asked whether I would go short on Friday? My answer was that I would go short when the market tells me.
That is critical, since the Dow had made new four months highs that day. Today is an important confirmation day. What I want to see is a break, not a bounce, of the lower trendline. (I will rephrase that if the market does break.) This tells us that there is more downside to come in the near term.
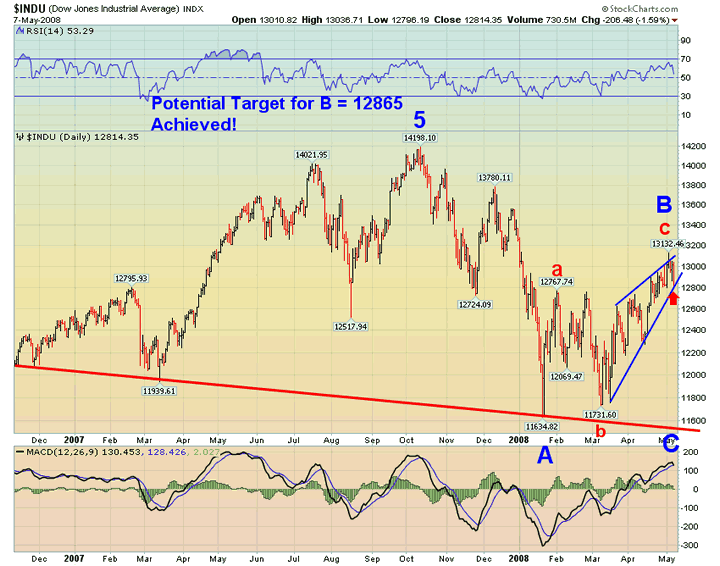
The second picture is a chart of the bearish wedge. One of the indications that the wedge is complete is the "throw-over" where the index punches throught the upper trendline. That is what happened at last week's show The throw-over only lasted a day, but the emotional pitch in the market was very tangible. You could cut the excitement with a knife. Unfortunately, traders and investors who don't have an objective rules-based view of the market can get sucked into the emotional fever and go long right at the peak. Today we find ourselves at the lower trendline waiting for it to break. Why? First, the throw-over was a completion pattern. Second, the wedge had achieved a guideline target of 12685, which I have had on my chart for several weeks. And third, my cyclical analysis suggested that Friday would be an "ideal" turn date.
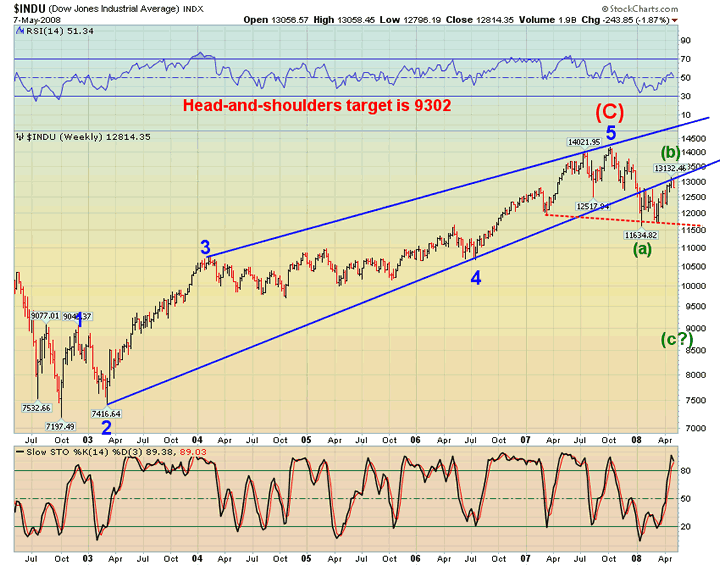
Finally, if we look at the thrid picture of the weekly Dow you can see
another completion pattern. On this chart I have the five-year trendline
that was broken in January. On last Thursday, the Dow tested the underside
of that trendline and failed. So where now, brown Dow? Again, let's look
at the rules of the market. Bearish wedges very quickly retrace themselves
in the next move down. Mike, there are no guarantees, but if the rules are
followed, the Dow may drop to 11600 in a very short span of time. Let's
continue to follow this chart next week. The reason is, if the market does
as I suggest, there is another formation ahead of us that also bears
watching.
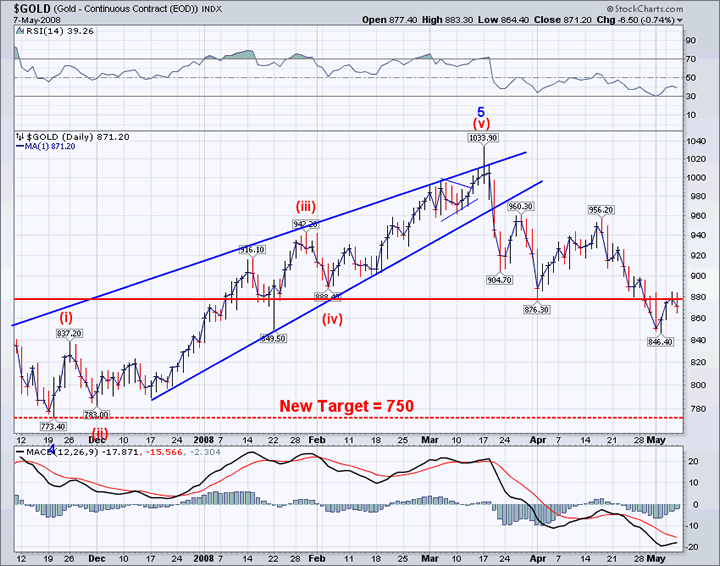
Let's take a look at the next picture of gold. You may recall that I had suggested that gold was finding a bottom last week and I was looking for a small rally in which to go long. Well, it happened. On Tuesday, my trading model suggested a top which coincided with a resistance line that I had noticed in the chart. Sure enough, the rally failed after probing briefly above resistance. What the chart is telling me now is that there is a potential for a significant drop in gold. I wish to point out the target for gold that I have had on this chart for several weeks. I am about to revise that target to 700-720. Here's why. That resistance line on the chart can now be called the neckline of a head-and-shoulders pattern with a minimum target of 723. In addition, there is a wave relationship here that strongly suggests a target of 707. Finally, my trading model suggests support at 718. What more can a trader ask for?
See you at 3:00 CST.
Which will it be? Stay tuned! on www.yorba.tv every Thursday at 4:00 pm EDT . You can find the archives of my latest programs by clicking here .
Please make an appointment to discuss our investment strategies by calling Claire or Tony at (517) 699-1554, ext 10 or 11. Or e-mail us at tpi@thepracticalinvestor.com .
Anthony M. Cherniawski,
President and CIO
http://www.thepracticalinvestor.com
As a State Registered Investment Advisor, The Practical Investor (TPI) manages private client investment portfolios using a proprietary investment strategy created by Chief Investment Officer Tony Cherniawski. Throughout 2000-01, when many investors felt the pain of double digit market losses, TPI successfully navigated the choppy investment waters, creating a profit for our private investment clients. With a focus on preserving assets and capitalizing on opportunities, TPI clients benefited greatly from the TPI strategies, allowing them to stay on track with their life goals
Disclaimer: The content in this article is written for educational and informational purposes only. There is no offer or recommendation to buy or sell any security and no information contained here should be interpreted or construed as investment advice. Do you own due diligence as the information in this article is the opinion of Anthony M. Cherniawski and subject to change without notice.
Anthony M. Cherniawski Archive |
© 2005-2022 http://www.MarketOracle.co.uk - The Market Oracle is a FREE Daily Financial Markets Analysis & Forecasting online publication.