


Sheffield House Prices Divergence - Silverdale Close, Affluent Area's Forecast
Housing-Market / Sheffield Jun 29, 2014 - 03:42 AM GMTBy: N_Walayat

 Sheffield house prices are showing a huge divergence between affluent and deprived areas of the city in terms of the rate of annual increase where typically affluent areas of the city are experiencing a trend in house price inflation of an average of 5% per annum whilst deprived areas are experiencing what can only be classed as random price action, where similar properties even on the same street can deviate greatly by as much as 1/3rd in price as illustrated by several study's of sale prices of properties sold across streets in deprived areas of the city that have yet to exhibit a trend in house prices.
S4 - Popple Street by Sale Date
| House No | Date Last Sale | Price Paid |
| 100 | Apr 14 | 45000 |
| 18 | Jan 14 | 66000 |
| 97 | Feb 13 | 52500 |
| 18 | Oct 12 | 70000 |
| 127 | June 12 | 49000 |
| 134 | Mar 12 | 46000 |
| 55 | Jan 12 | 40000 |
| 31 | Dec 11 | 40000 |
| 43 | Jul 11 | 51000 |
| 90 | June 11 | 69000 |
| 43 | Sept 10 | 47000 |
| 22 | Sept 10 | 65000 |
| 10 | June 10 | 80000 |
No clear discernable trend.
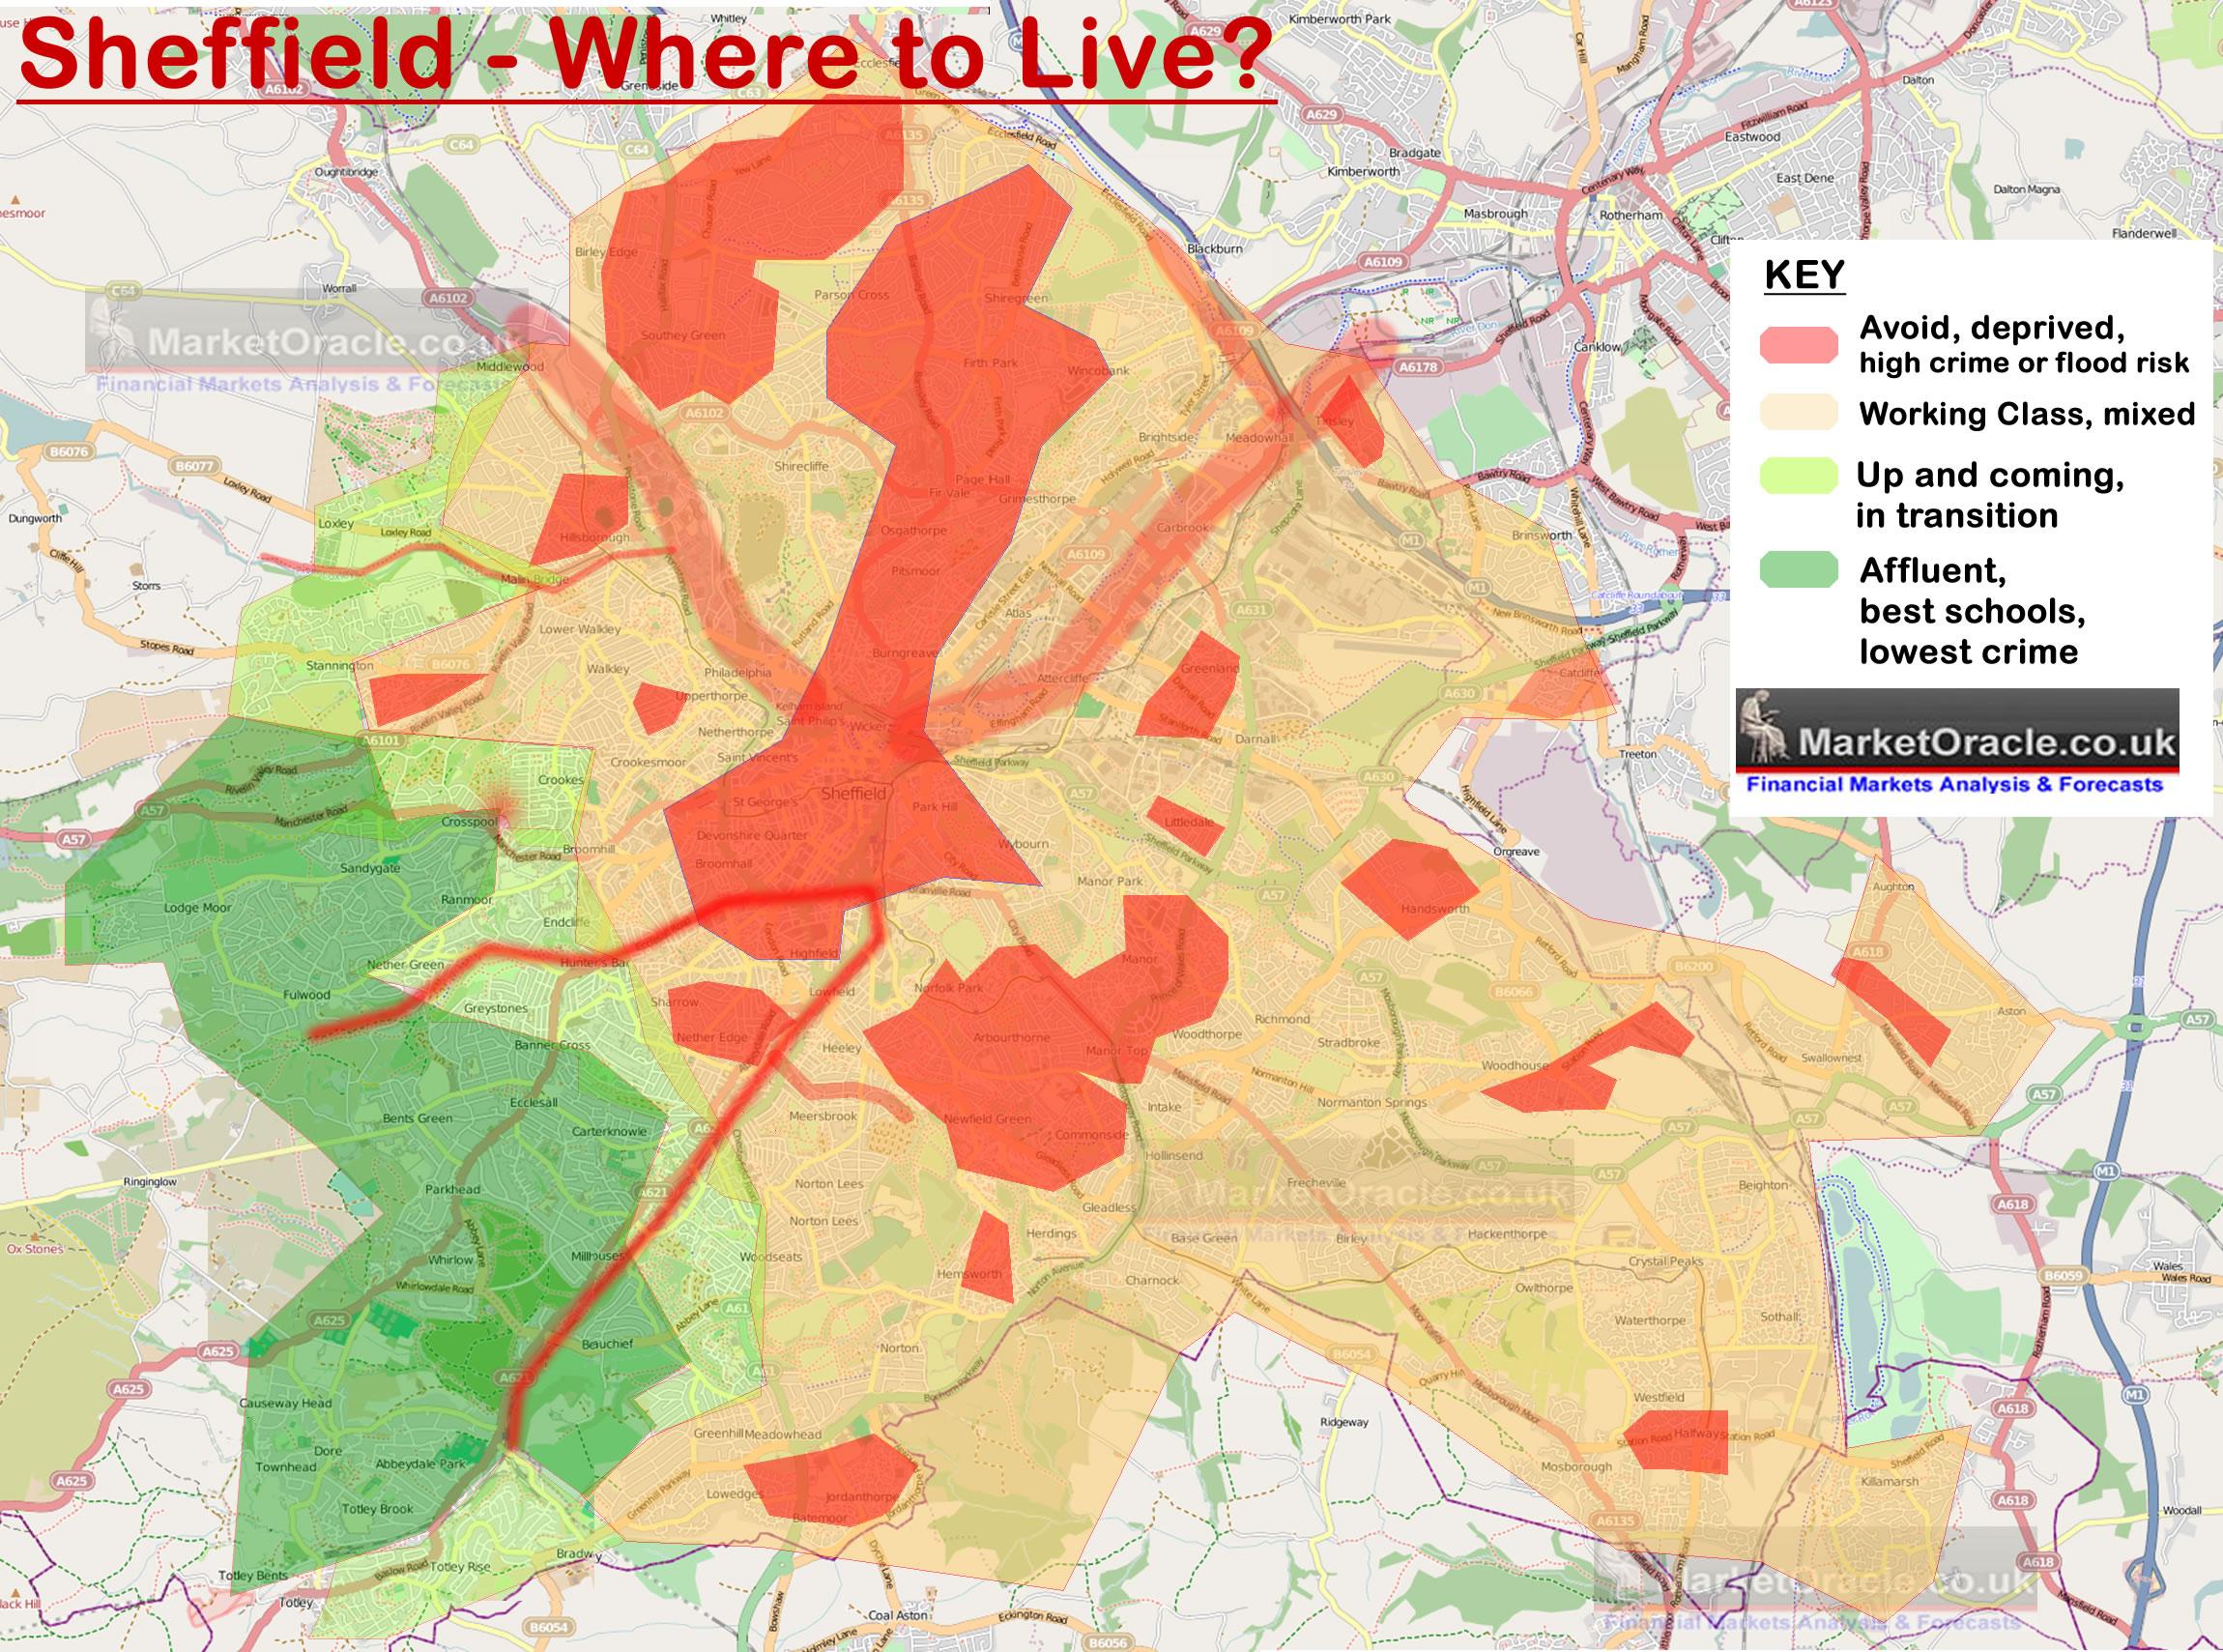
The below map illustrates the conclusion of - 31 Oct 2013 - Sheffield Best and Worst Areas to Live, House Buying Analysis Map
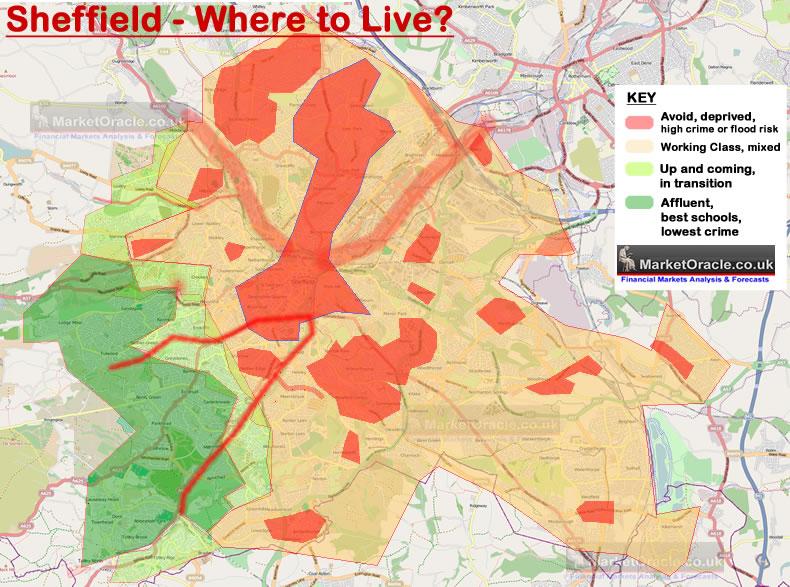
Click here for a Large version of the Where to Live Map
In summary, prospective home buyers should take notice of the fragmented nature of the city which can make a huge differences both in terms of the quality of life, school catchment etc. However, the best areas of the city can be found to be concentrated in the South West of the city as the affluent residents continue to price most local house hunters out of these areas, just as is the case for many areas of the UK. Furthermore, the most affluent area's of the city tend to have a buffer zone of up and coming areas that acts to further the gap in house prices between relatively short distances.
Affluent Areas of Sheffield
Sheffield House prices in the S11 area as illustrated by analysis of Silverdale Close are increasing at an average rate of 5% per annum, a trend that is inline with the national forecast for the UK housing bull market to trend higher into the end of 2018 and therefore whilst lagging the national average (10% per annum) still is represents a huge difference to that that which is transpiring in the deprived areas of the city.
However, it should be noted that house price valuation sites such as Zoopla and Mousprice.com tend to typically over value properties by an average of 5% as illustrated by the in-depth analysis of Silverdale Close, that could be extrapolated to other streets in the area.
S11 - Silverdale Close Ranked by Current Estimated Value
| Rank | House No | Zoopla/ Mouse Price Etc. | Analysed Est. Value | % over valued | Date Last Sale | Price Paid | Beds | Trend Forecast End 2018 |
|---|---|---|---|---|---|---|---|---|
| 1 | 9 | £552k | £525k | 4.8% | Dec 2009 | £499k | 5 | £630k |
| 2 | 3 | £498k | £479k | 3.8% | Jan 2012 | £450k | 6 | £575k |
| 3 | 27 | £465k | £450k | 3.2% | 4 | £526k | ||
| 3 | 29 | £463k | £450k | 2.8% | Apr 2008 | £450k | 4 | £527k |
| 5 | 21 | £474k | £446k | 5.9% | Oct 2013 | £422k | 4 | £522k |
| 6 | 7 | £463k | £445k | 4.0% | 5 | £522k | ||
| 7 | 18 | £437k | £441k | 1% | Sep 2010 | £405k | 5 | £529k |
| 7 | 19 | £468k | £441k | 5.7% | 4 | £516k | ||
| 7 | 20 | £471k | £441k | 6.3% | 4 | £516k | ||
| 7 | 25 | £456k | £441k | 3.2% | 4 | £529k | ||
| 11 | 5 | £419k | £435k | 3.8% | Jul 2006 | £390k | 4 | £522k |
| 11 | 6 | £459k | £435k | 5.2% | May 1998 | £155k | 4 | £522k |
| 11 | 10 | £441k | £435k | 1.3% | Jun 2002 | £225k | 5 | £508k |
| 11 | 12 | £453k | £435k | 3.9% | 5 | £537k | ||
| 11 | 16 | £456k | £435k | 9.2% | 4 | £509k | ||
| 16 | 23 | £441k | £435k | 1.3% | Apr 2012 | £405k | 4 | £522k |
| 17 | 1 | £452k | £431k | 4.5% | 5 | £517k | ||
| 18 | 15 | £458k | £430k | 6% | 4 | £503k | ||
| 19 | 8 | £440k | £414k | 5.9% | 4 | £484k | ||
| 20 | 11 | £413k | £414k | 4 | £497k | |||
| 20 | 14 | £456k | £414k | 9% | Aug 2003 | £332k | 5 | £497k |
| 20 | 17 | £450k | £414k | 8% | Sep 1997 | £135k | 4 | £484k |
| 23 | 4 | £430k | £410k | 4.7% | Feb 2013 | £390k | 4 | £475k |
| 24 | 2 | £399k | £390k | 2% | Nov 2011 | £371k | 4 | £450k |
* Analysed value takes into account Zoopla / Mouse price estimates, Last sale, recent similar sales in the area and current property structure (allowing for any additions etc).
* Forecast is based on average expectations of 5% per annum adjusted for trend trajectory over the past 2 years or since last sale.
Sheffield House Prices Conclusion
1. Deprived areas of the city have yet to exhibit a trend in house prices.
2. Affluent areas of the city are exhibiting an average trend of 5% per annum with a typical range of between 3.5% to 7%. This trend whilst lagging behind national house price inflation of 10% per annum is sustainable into at least the end 2018.
3. House price valuation sites typically tend to over value house prices by an average of 5%. Though the over valuation for individual properties can be substantial, therefore like for like comparisons need to be conducted against actual sold prices.
For more in-depth analysis of the UK housing market see the New UK Housing Market Ebook available for FREE DOWNLOAD (Only requirement is a valid email address).
 New Housing Market Ebook - FREE DOWNLOAD
The housing market ebook of over 300 pages comprises four main parts :
1. U.S. Housing Market Analysis and Trend Forecast 2013-2016 - 27 pages
The US housing market analysis and concluding trend forecast at the start of 2013 acted as a good lead exercise for the subsequent more in-depth analysis of the UK housing market.
2. U.K. Housing Market Analysis and House Prices Forecast 2014-2018 - 107 pages
The second part comprises the bulk of analysis that concludes in several detailed trend forecasts including that for UK house prices from 2014 to 2018 and their implications for the outcome of the next General Election (May 2015) as well as the Scottish Referendum.
3. Housing Market Guides - 138 Pages
Over 1/3rd of the ebook comprises of extensive guides that cover virtually every aspect of the process of buying, selling and owning properties, including many value increasing home improvements continuing on in how to save on running and repair costs with timely maintenance tasks and even guides on which value losing home improvements should be avoided.
4. Historic Analysis 2007 to 2012 - 40 pages
A selection of 10 historic articles of analysis to illustrate the process of analysis during key stages of the housing markets trend from the euphoric bubble high, to a state of denial as house prices entered a literal free fall, to the depths of depression and then emergence of the embryonic bull market during 2012 that gave birth to the bull market proper of 2013.
FREE DOWNLOAD (Only requirement is a valid email address)
Source and comments: http://www.marketoracle.co.uk/Article46249.html
By Nadeem Walayat
Copyright © 2005-2014 Marketoracle.co.uk (Market Oracle Ltd). All rights reserved.
Nadeem Walayat has over 25 years experience of trading derivatives, portfolio management and analysing the financial markets, including one of few who both anticipated and Beat the 1987 Crash. Nadeem's forward looking analysis focuses on UK inflation, economy, interest rates and housing market. He is the author of five ebook's in the The Inflation Mega-Trend and Stocks Stealth Bull Market series that can be downloaded for Free.


 Nadeem is the Editor of The Market Oracle, a FREE Daily Financial Markets Analysis & Forecasting online publication that presents in-depth analysis from over 1000 experienced analysts on a range of views of the probable direction of the financial markets, thus enabling our readers to arrive at an informed opinion on future market direction. http://www.marketoracle.co.uk
Disclaimer: The above is a matter of opinion provided for general information purposes only and is not intended as investment advice. Information and analysis above are derived from sources and utilising methods believed to be reliable, but we cannot accept responsibility for any trading losses you may incur as a result of this analysis. Individuals should consult with their personal financial advisors before engaging in any trading activities.
Nadeem Walayat Archive |
© 2005-2022 http://www.MarketOracle.co.uk - The Market Oracle is a FREE Daily Financial Markets Analysis & Forecasting online publication.