


Underappreciated Indicators to Guide You through a Debt-Saturated Economy
Economics / US Debt May 05, 2014 - 09:40 PM GMTBy: F_F_Wiley

 If you’re my generation or older, you may remember taking the original Pepsi Challenge – the Coke versus Pepsi taste testing booths that you would find at sporting events, fairs and similar venues. I took the Challenge and stuck with Coke. The majority of people went the other way, as confirmed by even Coke’s private tests. Nowadays, though, I’m guessing the public version of a Challenge booth would bring heckling from the nutrition-conscious folks at the Just Juice stand. The bigger challenges for Coke and Pepsi are health risks linked to their flagship products. Researchers are zeroing in on a handful of ingredients that may be harmful, such as sodium benzoate and phosphoric acid.
We have nothing to add to the soda studies, but they somehow seem similar to our research on debt. Like soft drinks, you can think of debt as having different ingredients, some benign and others risky. At the highest level, here are the ingredients that everyone should be aware of (hereafter, we’ll call them funding sources):
- Funding from outside the U.S.
- Funding from the Federal Reserve system
- Funding from private banks
- Funding from non-money savings
Over any period, we can examine the total amount of borrowing and divide it among these sources with only a small residual. Here’s a breakdown for the last 60 years:
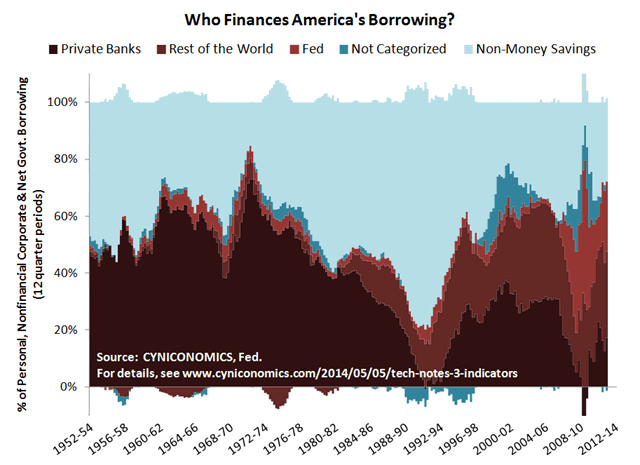
Now, you may look at this picture and see nothing interesting. If that’s all we have, then there’s no fizz in our soda, right? You already knew that foreigners, the Fed and private banks help to finance our debt. According to mainstream economic thought, that’s a good thing. We don’t think it’s quite that simple. We’ll show that credit financed by lenders outside the U.S., the Fed and private banks is a major source of economic volatility. We’ll also describe three indicators that help to size up the related risks.
First, though, we’ll define and comment briefly on each funding category shown in the chart. (If you’re just looking for the bottom line, skip to “Okay then, what should I be watching?”)
Funding from outside the U.S. Foreigners invest the proceeds of our current account deficits back into U.S. $-denominated investments. Therefore, the money that drains out of our real economy (when we import more than we export) flows back into our financial economy. Large amounts of these flows are unsustainable over the long-term and unstable through the business cycle. Inflows to the financial economy contribute to asset volatility and, in the extreme, bubbles. They also make it easier for politicians to increase public debt. Outflows from the real economy are linked to declining savings rates, which are harmless in the short-term but come back to bite when low-savers inevitably learn they’ve overspent. America’s mix of low personal savings and high public deficits owes much to credit market financing obtained from outside the U.S.
Funding from the Fed. Like foreign funding, too much credit from the Fed (primarily debt securities held on its balance sheet) contributes to financial volatility and declining savings rates. These effects are largely intentional. Central bankers who ramp up the supply of credit through, say, quantitative easing, aim to lower interest rates, thereby pushing up asset prices and encouraging more spending and less savings. What you won’t hear from these central bankers (unlike ex-central bankers, who sometimes spill the beans) is that near-term benefits are invariably followed by an opposite reaction once interest rates, asset prices and savings rates normalize.
Funding from private banks. In a fractional reserve system, banks create (“print”) money by conjuring up deposits to deliver loan proceeds. Generally, the extra deposits remain in the banking system for as long as the corresponding loans are retained on bank balance sheets. When loans are either paid down or sold off and removed from bank balance sheets, the extra deposits are extinguished. In other words, bank funding increases when the amount of credit that’s extended and retained on bank balance sheets is greater than the amount that’s paid down and removed from bank balance sheets. (Note that banks also create money through activities that don’t involve loans, but these tend to be either less significant or on the Fed’s behalf.)
Because of the link to loan issuance, bank funding typically boosts spending more immediately and certainly than funding supplied by the Fed. Not only that, but loans retained by banks deliver the extra oomph that comes from the fact that deposits are created from thin air. Setting aside potential inflation effects, bank lending essentially turbocharges the economy, creating a “virtuous” feedback loop where more spending leads to more production, which then leads to a higher level of income and reinforces the initial lift in spending.
Unfortunately, though, turbocharged lending eventually reaches borrowers who produce things that can’t be profitably sold. Or, it flows to home buyers and consumers who spend more than they can afford. Either way, loans go sour and the virtuous loop gives way to a vicious loop of less lending, spending, production and income.
Many economists, although mainly from outside the mainstream such as Austrian business cycle theorists and Chicago Plan advocates, recognize that vicious loops are a natural consequence of balance sheet expansion by banks in a fractional reserve system. While it’s not the only culprit, we’ll demonstrate the link between bank balance sheets and economic volatility in just a moment.
Funding from non-money savings. Debt that’s placed directly with domestic, non-bank investors – through either debt security issuance or loans that banks choose to sell and move off their balance sheets – is fundamentally different from other sources of funding. It’s financed by 100% genuine, domestic savings. It excludes the monetary expansion that occurs when banks match a loan on the asset side of the balance sheet with a newly-created deposit on the liability side, thereby lifting the supply of credit without a prior increase in savings.
Most of the non-money savings in our economy comes from households, pension funds and insurance companies. You shouldn’t think of these sources of funding as completely risk-free, but they’re the Just Juices of the credit markets. Or, you can think of them as the relatively harmless ingredients in your soda that are mixed with the more dangerous stuff when other funding sources come into play.
Uncategorized funding. This is our residual category, which has negligible effects on the analysis. It’s explained in the accompanying “technical notes” post.
. . .
Okay then, what should I be watching?
Now for our three indicators. We start by estimating the percentage of total borrowing that’s funded by the three riskiest sources (the red-shaded areas of the chart above), rather than non-money savings:
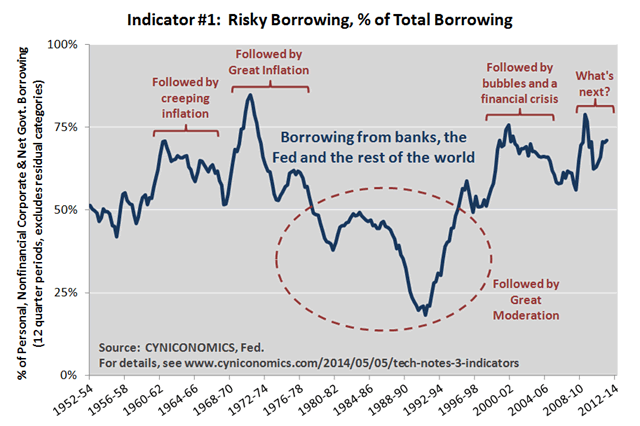
As noted on the chart, three periods stand out for an unusually high percentage of risky borrowing. The first two coincide with the creeping inflation of the 1960s and Great Inflation of the 1970s. The third overlaps the serial bubbles of the last two decades and leads into the 2008 financial crisis. While some may call this a coincidence, we beg to differ. Problems with either inflation or financial instability are exactly what you should expect when debt funding is tilted heavily towards risky sources.
Next, we divide risky borrowing by GDP:
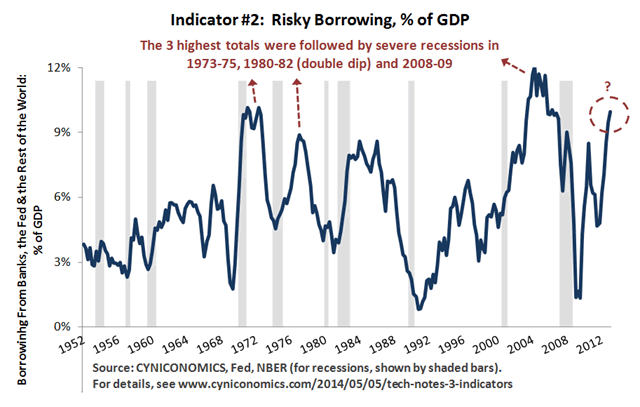
This chart can help you gauge how hard the economy might fall after the inevitable cracks appear in credit markets. Not surprisingly, it shows that the three periods with the greatest amounts of risky borrowing were followed by the three hardest falls – severe recessions in 1973-75, 1980-82 and 2008-09.
You may have also noticed that virtually every recession follows a drop in risky borrowing. This, too, shouldn’t be surprising. If you agree that large amounts of risky borrowing eventually lead to vicious circles – in which soured loans and a slower borrowing pace drag economic activity lower – then you should expect recessions to occur after risky borrowing peaks. This is exactly what we see.
We create a third indicator by measuring the change in risky borrowing. Using two year changes, it looks like this:
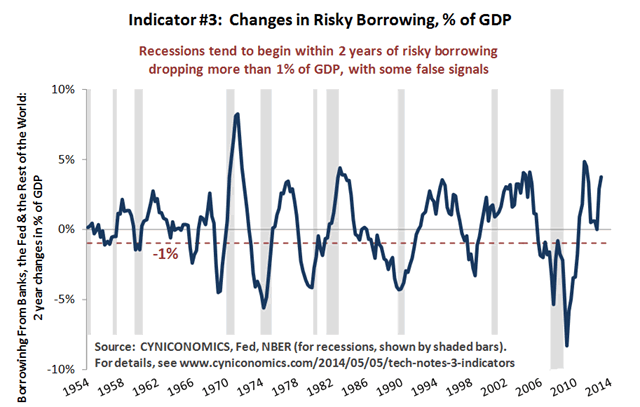
This isn’t a perfect recession predictor (there’s no such thing), but it helps to narrow down recession probabilities. And while it doesn’t offer ironclad proof that borrowing in excess of non-money savings leads to recessions (once again, there’s no such thing), it fits into the very process described by economists who’ve dared suggest that such borrowing is risky.
The bigger picture
We recommend including the three indicators in any risk analysis, alongside other factors such as debt ratios and interest rates. Debt ratios show the economy becoming more and more saturated with debt. We’ve seen steady increases in debt-to-GDP, debt-to-income, debt-to-sales, debt-to-assets; name the ratio and we’ll show you an unsustainable upwards trend. (We won’t repeat the charts here, but you can go to our last post and work backwards to others showing data on public and private debt.)
These upwards trends are a direct consequence of the risky borrowing shown in the charts above. If borrowing was limited to amounts funded with non-money savings, debt ratios wouldn’t rise. Even a modest margin above non-money savings would leave debt ratios stable. As it is, risky borrowing averaged 8% between 2002 and 2013, a pace that you can call hell-for-leather without much exaggeration. The post-2009 average is only slightly lower at 7% of GDP, thanks to money printing at the Fed and a shift in the debt mix from private borrowers to the U.S. Treasury.
Interest rate developments are another important part of the picture. Falling rates may explain why risky borrowing declined sharply in the mid to late 1980s without an especially severe recession. The secular decline in rates continued to provide tailwinds in the 1990s and 2000s, but these tailwinds shouldn’t have much power left, if any, now that we’ve reached the zero lower bound.
Conclusions for today’s economy
There are two particular messages in the latest indicator readings. First, with risky borrowing on the upswing, we’re still not seeing a recession signal. This is consistent with several other business cycle indicators that remain benign, such as profit margins (still high), bank lending standards (mixed) and the yield curve (still positive).
Second, the risky borrowing indicators are troubling, nonetheless. They show that we’ve reverted to old habits of borrowing far more than we can fund with non-money savings. At almost 10% of GDP in 2013, risky borrowing is higher than in all but the early 1970s and middle part of the last decade. This tells us that we’re accumulating risk at a rapid clip, although not for as long as in those earlier episodes. (Yet.)
Worse still, policymakers and mainstream economists are unperturbed, failing to acknowledge that some types of financing are riskier than others. It’s as if we’re stuck at a 1970s Pepsi Challenge booth, watching people debate cola tastes with no mention of health risks. With ample evidence of these risks, how can this be? One theory is that the current generation of mainstream economists staked their careers on the soda business, filling resumes with research on topics such as sweetness and carbonation, but nothing on health. It’s just too big a step for them to acknowledge that the old research is unhelpful and the resumes hollow. We can only hope that the unpopular, long-term thinkers who are willing to take that step become more influential over time.
In the meantime, keep an eye on the sources of financing and, in particular, the three indicators of risky borrowing discussed above.
(Click here for technical notes about this article and a few more charts.)
F.F. Wiley
F.F. Wiley is a professional name for an experienced asset manager whose work has been included in the CFA program and featured in academic journals and other industry publications. He has advised and managed money for large institutions, sovereigns, wealthy individuals and financial advisors.
© 2014 Copyright F.F. Wiley - All Rights Reserved
Disclaimer: The above is a matter of opinion provided for general information purposes only and is not intended as investment advice. Information and analysis above are derived from sources and utilising methods believed to be reliable, but we cannot accept responsibility for any losses you may incur as a result of this analysis. Individuals should consult with their personal financial advisors.
© 2005-2022 http://www.MarketOracle.co.uk - The Market Oracle is a FREE Daily Financial Markets Analysis & Forecasting online publication.