Peak Coal
Commodities / Coal Apr 15, 2014 - 04:10 PM GMTBy: Ronald_R_Cooke
 Properties
Comments about coal are usually not complimentary. Despite our dependence on it as a source of heat for electric power generation, environmentalists wish it would go away. On the other hand, advocates like to claim we have more than 110 years of coal left – “at present rates of consumption”. Both sides are overlooking crucial points. Let’s see if we can clarify the future use of coal as a fossil fuel resource.
To begin with, it is important to understand not all coal is of equal quality. When I was in grade school, we lived in a house that had a coal furnace. For those who could get it, the coal of choice of home heating applications was anthracite coal because it was the cleanest burning form of coal and provided – ton for ton – the most heat. Unfortunately, we humans have used up most of the readily available anthracite coal. Future consumption will depend on the other three kinds of coal: bituminous, sub – bituminous and lignite.
Most of the commonly produced (and consumed) coals are of two types:
· Bituminous coal or black coal is a relatively soft coal that contains a tarlike substance called bitumen. It has a 45% to 86% carbon content. Although primarily used for steam powered electricity generation, high quality bituminous coal can be converted to a coking coal used in the production of steel and iron.
· Sub-bituminous coal contains 35% to 45% carbon. Like bituminous coal, it is primarily used for the generation of steam powered electricity.
Other applications for bituminous coals include their use as a source of heat for kilns in the manufacture of cement and brick, heat for the smelting of metals, and as a source material for the manufacture of liquid fuels, methanol, fertilizer, shingles, and the coal tar we use for the manufacture of plastics, perfumes, mothballs, medicine, dyes, explosives and flavorings. There are even a few coal fired steam locomotives in use.
As we use these coals up, what we will have left is a soft brown combustible sedimentary rock of relatively low heat content called lignite. Used as a steam coal to produce electricity, lignite has a low carbon content (25% to 35%). Because it contains relatively high quantities of ash and moisture, lignite is often called the “dirty” coal.
It is the carbon content of coal that supports the combustion process. The higher the carbon content, the greater the heat value per ton. Coals are also graded according to plasticity, and their moisture, volatile, ash, sulfur and chemical content. The values in the following chart are an approximation of ranges.
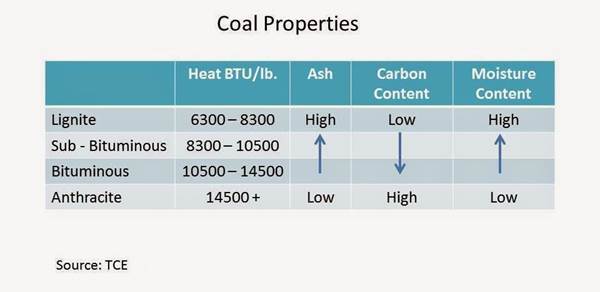
Generally speaking, power companies want the lowest ash and sulfur content, as well as the highest heat value per ton. That fact tends to favor the consumption of bituminous coal over sub-bituminous coal, and both of these coals over lignite. From 1992 through 2012, the total world heat content per ton of the coal we humans consumed fell by more than 10 percent. This means that as we become more dependent on the consumption of coals of lesser heat value, the rate of actual consumption (in tons) will have to increase in order to provide the same amount of heat energy.
Resources and Reserves
Although these two terms are often used as though they are interchangeable, they have very different meanings when we are discussing fossil fuels. The term “resource” refers to the maximum quantity of coal that exists on our planet, irrespective of density, form or location. Coal resource estimates vary widely (up to 11 trillion tons), and are the source of some confusion since many infer that all of this coal can be produced. Compared with current production, there are many who believe our coal reserves will last “forever”.
Unfortunately, most of these “reserves” are useless. We have the same logistics problem with coal that we have with oil. The resource base is far larger than the quantity that is technically and economically recoverable. Coal is embedded in other material (often multiple seams of other overlay), may exist far below the surface of the earth, and may occur in small quantities, irregular pockets, or thin layers that make production impractical. We expect some of this resource base (how much is unknown) is under the ice and oceans that cover vast areas of our planet. In order to produce coal, we must first find it and exploration is an uncertain undertaking. And finally, even if we find a seam of coal, it may not be technically or economically or politically feasible to go into production.
After the elimination of useless deposits, my guess (WAG) is that we humans have inherited approximately 3.4 trillion tons of coal. Of this, perhaps 1.1 to 1.3 trillion tons will eventually be produced.
And that brings us to reserves. When we talk about reserves there are possible reserves (it is possible they will be found and produced), probable reserves (we think we know where they are and believe they can be produced) and proved reserves (the location, size and characteristics of the coal deposit are known and have been evaluated).
According to World Energy Council data, we have proved reserves of over 400 billion tons of anthracite and bituminous coal, and over 450 billion tons of sub-bituminous and lignite coal left on our planet. The term “proved reserves” usually refers to those quantities of coal that geological and engineering information indicates with reasonable certainty can be produced in the future from known deposits under existing economic and operating conditions. In the following graph we can see that Europe and Eurasia have the largest proved reserves (35% by tonnage), followed by the Asia Pacific region (31%), and North America (28%). Most of the coal in the Europe Eurasia region can be found in Russia, Germany, Ukraine, and Kazakhstan. If Russia takes over the Ukraine and effectively dominates Kazakhstan, it will control 26 percent of the world’s proven reserves of coal.
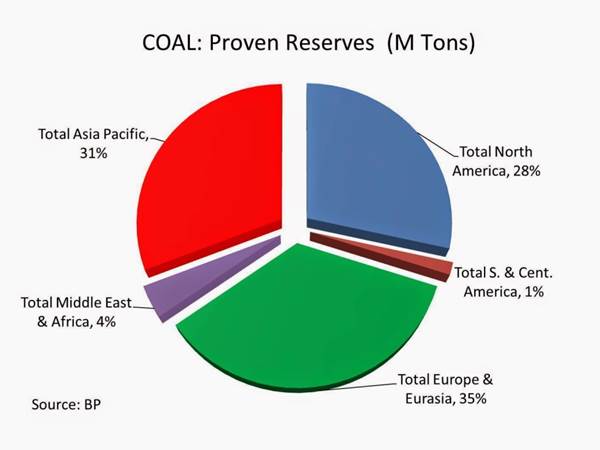
Higher prices for coal and evolving technology will increase our calculation of economically proven reserves. If my coal resource “guess” is approximately correct, we have 850 billion tons of proven reserves, 200 billion tons of probable reserves, and 250 tons of possible reserves left to consume on our planet. Fair warning: these are optimistic projections.
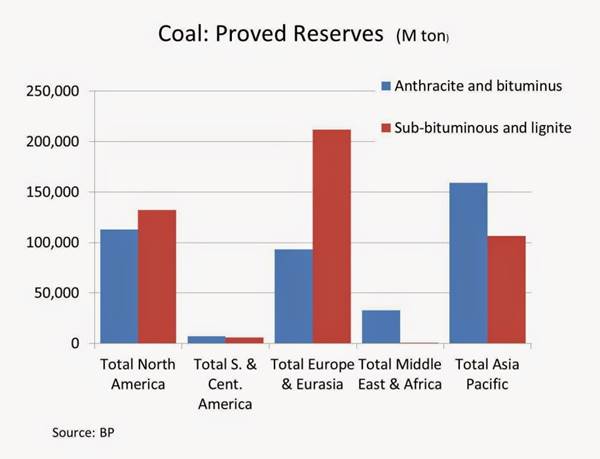
Proven reserves are broken down by type of coal in the next graph. Seventy percent of the coal found in Europe and Eurasia, 40 percent of the coal in the Asia Pacific region, and 54 percent of North American coal resource base is of lower quality sub-bituminous and lignite coals.
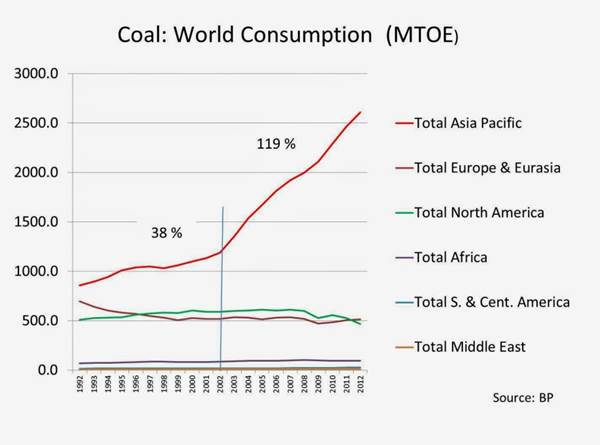
Consumption World coal consumption has been increasing and reached 3730 MTOE (Million Tons Oil Equivalent) in 2012. The largest national consumer is China. There was a slight decline in coal consumption within the United States and Europe from 1992 through 2012. Consumption within the Asia Pacific region, however, increased by 38 percent from 1992 through 2002, and 119 percent from 2002 through 2012. China now consumes more coal (50.6 percent of world consumption) than all other nations put together. That means, of course, China also pollutes the air with more combustion products from the consumption of coal than any other nation. (Note 1) Large coal fired plants are under construction or in proposal stages for many nations including China, India, Germany, Russia, Vietnam, Pakistan, Sri Lanka and on and on. These nations will not stop burning coal because they cannot stop. The consumption of coal is embedded in their economic policies.
In addition, over 3 billion people living in poor nations are looking for a better life. That means they need more steel (processed using coking coal), and a lot more electricity. One of the criticisms of the recent IPCC report is that it would seem to condemn people who happen to live in a poor nation to irreversible poverty – because the IPCC recommendations would severely limit their access to electricity. Thus while some Western nations may temporarily reduce their consumption of coal, international demand will increase – most notably in the Western Pacific region.
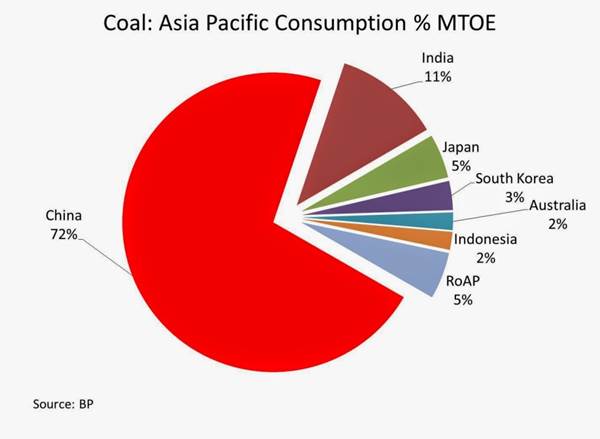
In the following graph, we can see how Chinese coal consumption (72%) dwarfs all other nations in the Asia Pacific region. National governments, particularly in China and India, are committed to economic expansion. China’s consumption of electricity is expected to increase, on average, by five percent per year through 2030. Although it is planning to reduce its reliance on coal for future power generation, China will likely build more than 300 new coal fired plants with a total capacity of 350 – 450 GW over the next 10 to 15 years. Japan is likely to increase its coal fired plant capacity by 30 percent over the next 10 years to replace, and augment, nuclear power generation. About 60% of India's thermal power generation comes from coal-fired power plants and this capacity is scheduled to expand by 500 GW (111 percent).
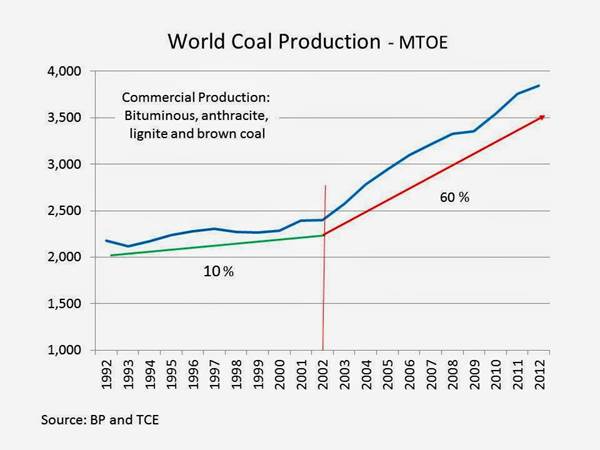
Production and Price Thus far, world coal production has kept up with this dramatic increase in demand. Total world coal production increased by 10 percent in the period from 1992 through 2012, and by 60 percent from 2002 through 2012. World production now exceeds 3845 MTOE per year.
As one would suspect, a growing demand for coal has stimulated higher prices. The United States Central Appalachian index has increased 148% from ~ $29 per ton in 1992 to ~ $72 per ton in 2012. The price the Japanese pay for imported steam coal increased 179% from ~ $48 per ton in 1992 to $ 134 per ton in 2012. Note that coal price increases accelerated between 2002 and 2012. World energy prices for all fossil fuels spiked in 2008, causing food riots in several nations. Coal was no exception even though its consumption had little direct effect on food production. Excess production caused a supply/demand imbalance in 2012 and coal prices subsequently declined in 2013. It is probable that the price of coal will again resume its upward trend before 2016.
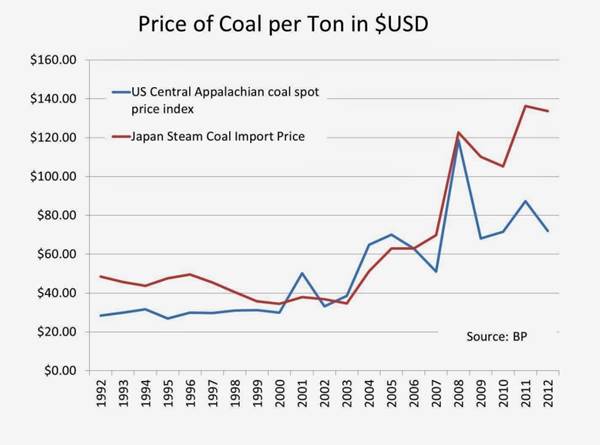
The price of coal is probably more elastic than the price of oil or natural gas because most of the direct consumers are either corporations or national governments. These entities pass escalating coal prices on to the consumer in the form of higher prices for electricity and mass produced goods. The pain of higher indirect coal prices is spread over a large base of consumers. However, there are limits to indirect price escalation and we should expect consumers in developed nations to become increasingly interested in energy conservation and the purchase of goods that use less electricity.
We should also be aware that long term coal prices tend to be influenced by the price of natural gas and oil. Oil prices are projected to increase substantially as we approach peak oil, and that will increase national interest in the conversion of coal into motor fuel. This will have an upward effect on both the demand for coal and the price of coal per ton.
Peak Coal In terms of Peak Coal, we actually will have two peaks: one measured by heat content, and one measured by maximum tons produced. Considering the decline of our anthracite resources, and the increasing production of sub-bituminous and lignite coals, there are those who believe we have already passed Peak Coal based on heat (energy) content.
After we take all of these factors into consideration, and make our assumptions about resource availability, production, consumption, price escalation, consumer behavior, government response, and so on.... we can (with some apprehension) calculate the date of Peak Coal. Between 2012 and 2035 annual coal production will increase by ~47 percent. Production begins to stall around 2030, and the curve flattens through the year of peak production - 2035. Thereafter it declines rather quickly because the remaining reserves are more difficult and costly to exploit. Please note there is a lot of production after 2035. But annual average production decreases with each passing year. We will probably be into the next century before the last nugget is pulled from the ground, and that – of course – is what people think they mean when they say... “We have enough coal to last 110 years”. We will have some coal left, but not enough to satisfy demand. Not even close.
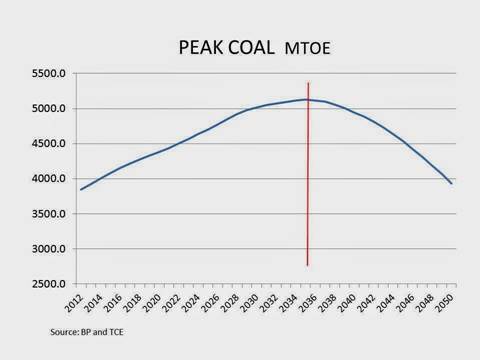
So... just how good is this prediction? It is not a number I pulled from a hat. It is backed by hours of research and a rather large spread sheet. Never-the-less, there are a few analysts who believe I am being too optimistic. On the other hand, most pundits, particularly those associated with the coal industry, will probably assert I am far too pessimistic. (Note 2)
The strength of this prediction depends on several factors which are unknown and unknowable. For example, there is always the hope we humans will find additional seams of coal south of the equator, or in Siberia, or off shore Australia, or in Canada. In situ coal seam gasification would open up additional offshore and under ice resources as well as onshore reserves to production. If we find a way to exploit an additional 200 billion tons of coal, that would delay Peak Coal by perhaps 25 – 35 years, and move the date of Peak Coal to ~ 2065.
So, in the final analysis, we just do not know the date of Peak Coal. We can only make our estimates based on current data that is available to the public. Unless we substantially increase our proven reserves, that information definitely indicates Peak Coal will occur before 2050.
But - I could be wrong. You decide.
TCE
MTOE: The tonne of oil equivalent (toe) is a unit of energy: the amount of energy released by burning one tonne of crude oil.
Note 1: China now accounts for more than 27% of world carbon dioxide emissions, followed by the United States (17%), India (5.5%), and Russia (5.1%). American CO2 emissions have fallen by more than 9 percent since 2000. By contrast, Chinese carbon dioxide emissions were up by 168 percent during this period.
Note 2: With special thanks to BP, several national coal agencies, the IEA (International Energy Agency), the IMF (International Monetary Fund), the World Coal Association, and several investment research sites (along with a few blogs).
Ronald R. Cooke
The Cultural Economist
Author: Detensive Nation
www.tceconomist.blogspot.com
Cultural economics is the study of how we interact with economic events and conditions. Culture, in this sense, includes our political systems, religious beliefs, psychology, history, customs, arts, sciences, and education. The term "Economics" refers to the extent and process of how we employ capital, labor and materials. If human existence is dynamic, then economics – as a science – must be able to characterize the interaction of culture and economics in contemporaneous terms.
© 2005-2022 http://www.MarketOracle.co.uk - The Market Oracle is a FREE Daily Financial Markets Analysis & Forecasting online publication.


