GOLD Elliott Wave Analysis - Is Gold Really Safe? We Think Not
Commodities / Forecasts & Technical Analysis Mar 04, 2007 - 01:04 AM GMTBy: Francois_Soto
 Gold Truly Didn't Shine this Week
After trying to test without any success the $700 psychological level, the gold commodity plunged by more than $50 to nearly $640 this Friday from its short term top of $690. In the potential bear market that may occur in equities, are gold and gold stocks really safe investments in a mid term perspective? This is the question we will try to answer in this analysis using mainly the Elliott Wave Theory.
The Gold Commodity
The first question before starting the analysis is: When did the bull market in the gold commodity really begin? By looking at gold commodity in $USD, it's not that easy to answer this question because there are two possible periods: either mid 1999 or early 2001.
By looking at first glance the gold commodity chart in $USD, the count doesn't appear to be that obvious. However, displaying the gold commodity chart in other currencies makes all the difference! Let's take a look at the gold commodity chart below in other currencies:
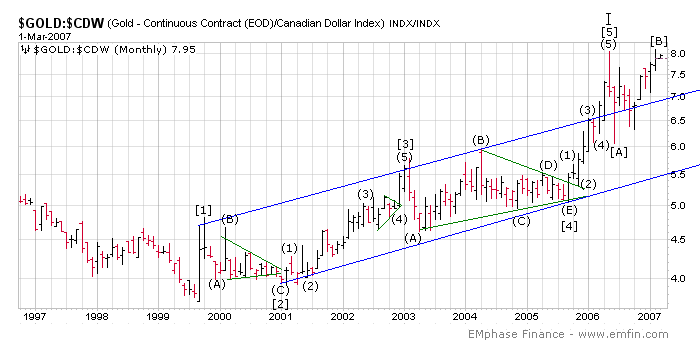
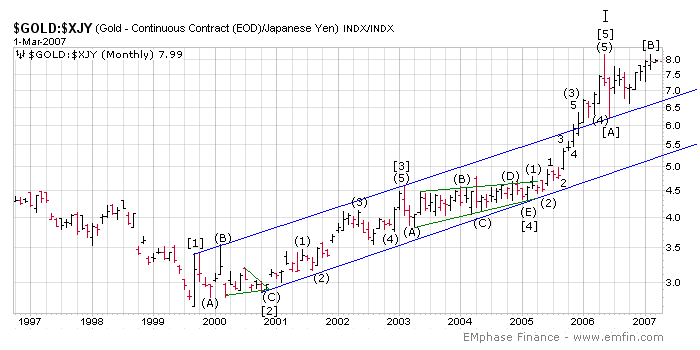
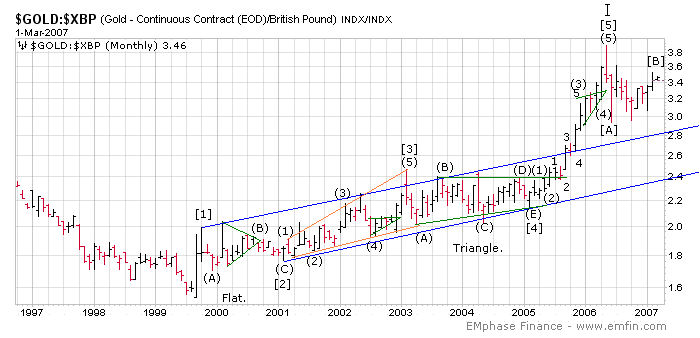
We can notice it is possible to trace a perfect channel. The channel resistance is connecting primary [1] with primary [3] and the channel support is connecting primary [2] with primary [4]. We can observe a very large symmetrical triangle that occurred between 2003 and that ended in late 2005 in all the currencies.
Resolved Issue
There was a discussion going on lately regarding if this count was really valid because secondary (A) of the primary [4] triangle is breaking the top of primary [1]. The Third Rule of Elliott says clearly that wave 4 cannot overlap wave 1. However, what if the wave 4 is a triangle? Can its wave A overlap wave 1 (while its wave E does not)? To assure you the validity of this count, we asked this question to EWI and here is the answer:
« The most rigid interpretation of the "no-overlap" rule applies to the END of wave 4 versus the end of wave 1. As to any other variations - use your judgment. That is, are all the other rules and guidelines for a "perfect wave" met if you allow just a little overlap between wave A of 4 and wave 1 (EW channel, Fibonacci, alternation, etc.)? If so, then perhaps that is the best interpretation. »
Gold Completed 5 Waves
Now that the count is resolved in other currencies, lets count it again but with the gold commodity in $USD. The count is displayed below. The only difference between $USD and the other currencies is that the channel resistance doesn't connect with primary [3] in $USD. Everything else is exactly the same otherwise.
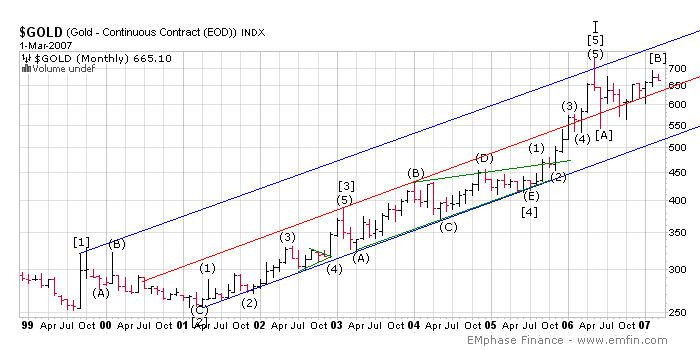
We notice primary [5] reached a high of $730 in May of 2006. This primary [5] finished the whole cycle I in the gold commodity. Since then, the gold commodity started a corrective pattern that is not finished yet.
Further Decline Ahead
We can conclude from these charts that the mid term outlook regarding the gold commodity doesn't look very promising. The current drop in price we experienced this week would actually be the beginning of primary [C] of cycle II.
How far cycle II of gold is going to correct? A general Elliott Wave guideline stipulates a correction often retraces to the level of the end of a wave 4. In that case, the end of primary [4] is near the 400 level. Basically, we could see the gold commodity go as low as $400 but that is just a guideline. A minimal target to achieve would be around $550, which is the low of primary [A] of cycle II.
Does this make sense in a fundamental perspective?
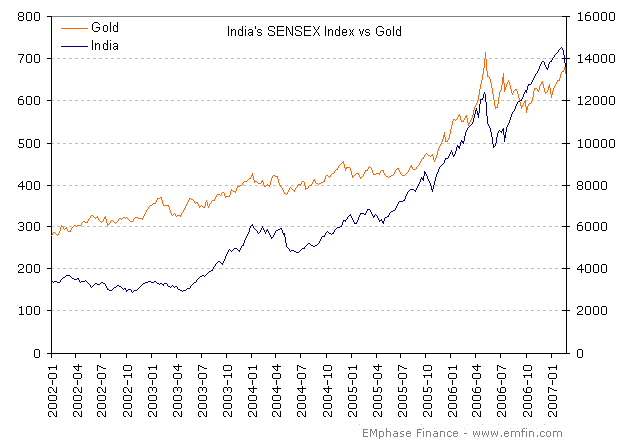
We think so. Gold is usually a safe haven but its price surged way too quickly since the mid 2005 up to its peak of May 2006. It's been the target of massive speculation and demand from emerging countries like India, one of the biggest buyers of gold worldwide… So much that the stock index in India got a very high correlation with the gold commodity! See the chart below.
Emerging Countries and Materials
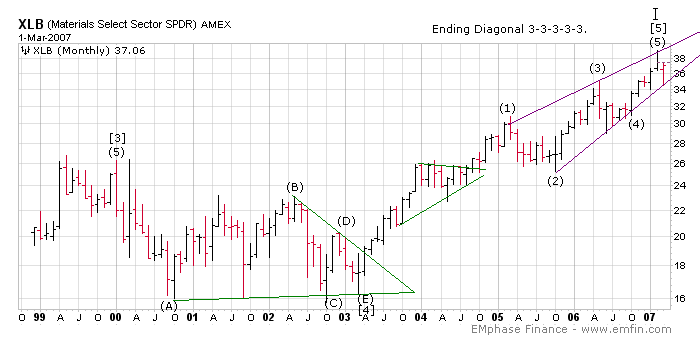
Finally, most emerging countries stock indexes increased exponentially in the last years without any major setback and they are starting to look overvalued that even the Chinese Government admits the Chinese stocks are overvalued! If the stock market of emerging countries from the BRIC like Brazil, Russia, China and India starts to collapse, it may also take the gold along with all the materials (precious and non precious). The XLB Materials AMEX Index topped recently by making an ending diagonal and is also ready to suffer from a potential decline.
Mining Stocks Technical Outlook
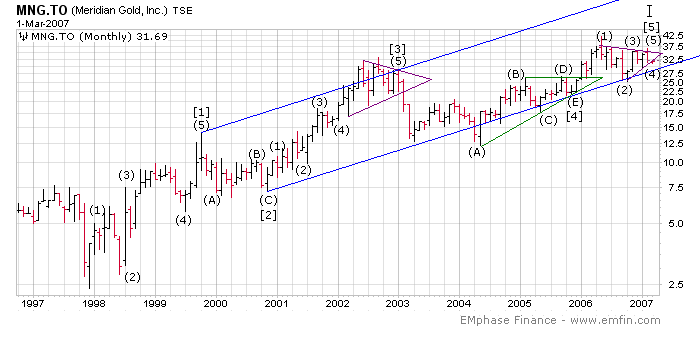
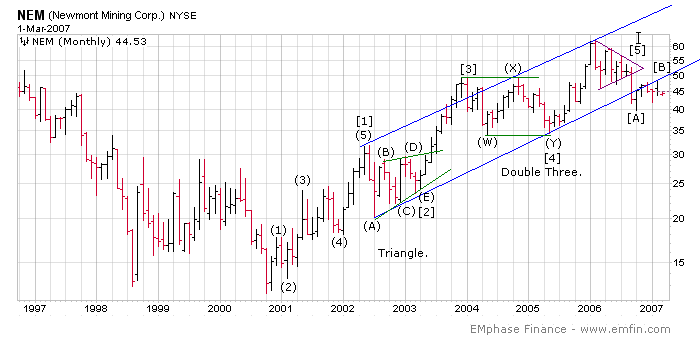
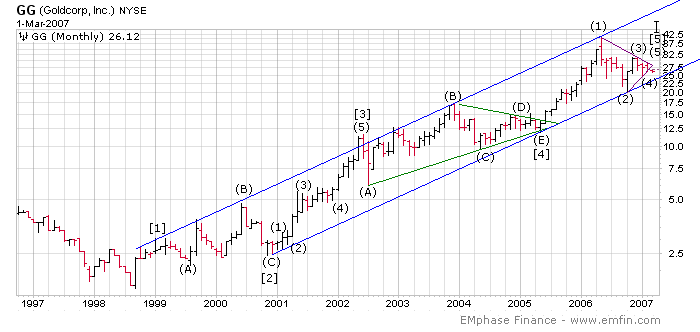
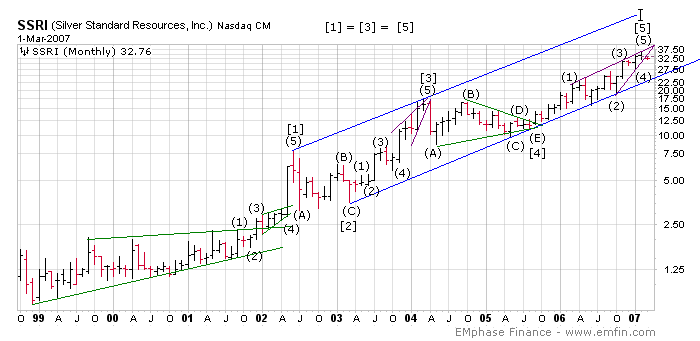
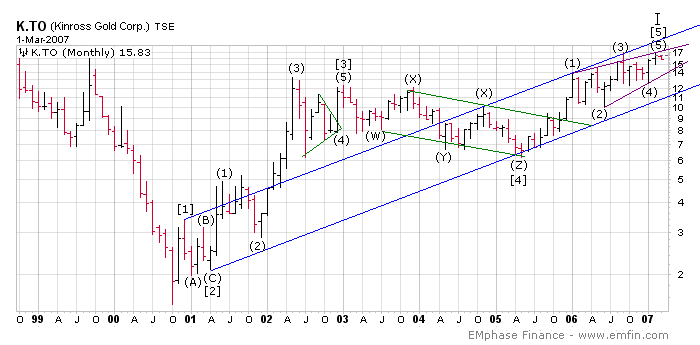
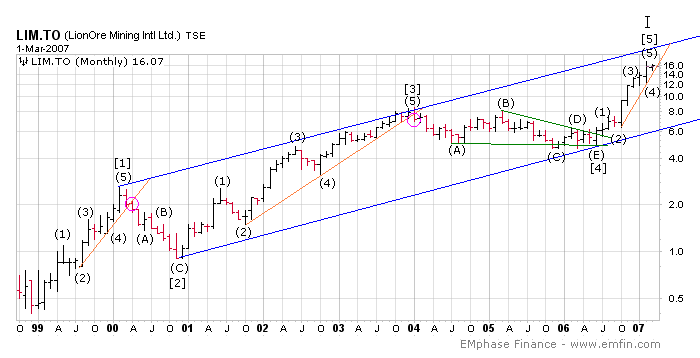
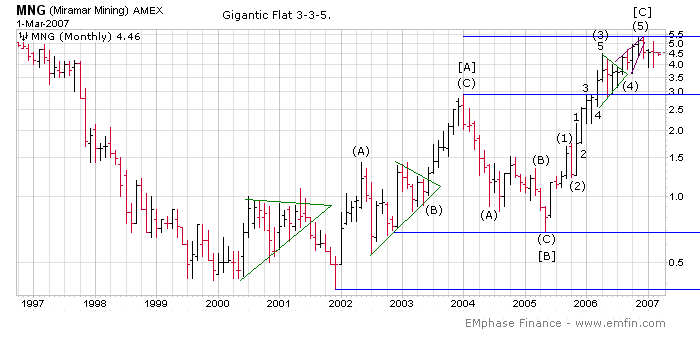
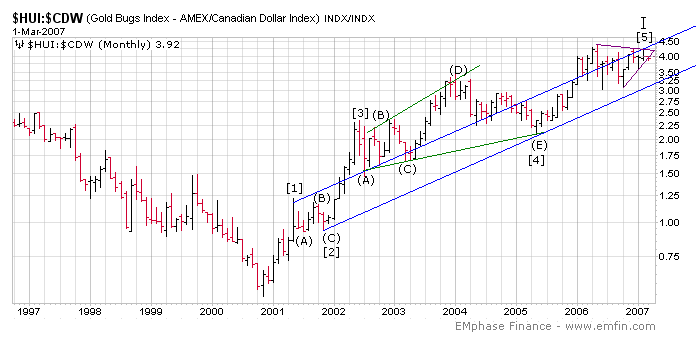
Now that we finished analyzing the gold commodity, let's verify if we can corroborate this result with prices of mining stocks. We took a look at various companies, all related in some way to the gold or silver commodity. You can view the counts on each of these companies below and also the HUI Gold Bugs Index. They all finished their cycle I and started cycle II except LionOre Mining because the company is also producing nickel and nickel is still a strong commodity. However, the upside potential of that stock seems fairly limited as its approaching from its resistance channel.
Mining Stocks Fundamental Outlook
These cyclical stocks are starting to get overvalued. Yes, even if some of them are having cheap P/E's between 5-10. Just remember that in a top of a commodity cycle, mining stocks are generating lots of profits while the reverse situation happens at the bottom of a commodity cycle. This affects the denominator of the ratio and may be counter-intuitive.
Quick Recap
The whole material sector and the gold commodity along with the gold mining stocks may take a beating in a mid term perspective. The best way to describe the situation would be to compare some of these mining stocks to tech companies at the crest of the speculative bubble in 2000.
By Francois
Soto, President
EMphase Finance
www.emfin.com
© EMphase Finance. All rights reserved.
EMphase Finance strives to become one of the most important website in North America concerning fundamental analysis using traditionnal quantitative and technical analysis based on the Elliott Wave Principle. The website will contain detailed analysises concerning specific companies, commodities and indexes along with educational content.
© 2005-2022 http://www.MarketOracle.co.uk - The Market Oracle is a FREE Daily Financial Markets Analysis & Forecasting online publication.


