Why We Can Not Buy Our Way Out Of Debt
Interest-Rates / US Debt Jan 16, 2014 - 07:08 AM GMTBy: Raul_I_Meijer
 Last week, there was a discussion in our comments section about the financial “crunch”, the big kahuna, and how it still has not happened despite our insisting it is inevitable, with people saying things like: ‘but the stock markets are way up!’, and ‘in my area home prices are up 30%’. As much as I understand the sentiments, at the same time I don’t really. Certainly for people who read The Automatic Earth, I would have thought it would be clearer what is going on “out there”. I have certainly written more articles than I care to remember about what goes on. Debt is what goes on.
Because in order to understand what really goes on in the world of finance, and the economy at large, today, you need to know only one word: debt (aka credit). And you then ask yourself with everything you read: what about the debt? It’s a question largely absent from the media, other than in yet another Mexican standoff at the US Congress about the debt ceiling.
But you don’t need to be an Einstein to figure out why the stock markets set records, or why housing prices in the US and UK are rising, even if the media prefer to ignore why they do. All you need is that one question: what about the debt? Once you start looking at things with that question always in the back of your mind, the picture becomes – literally – painfully clear.
As I put it in that comment thread: 
“As for that crunch, being skeptical of a crunch is what we do, all the time, day after day after day. But all I see is a crunch that grows in size day by day, because people let themselves get fooled into thinking that not only can debt be paid off with more debt, but that they will actually profit from this being executed in their name, and with their money. Look, the S&P breaks another record! Well, you certainly earned that look, because you’re paying for it.
If people still think we were wrong, and are wrong, about that crunch, let’s talk, but they need something better to bring to the table than S&P records or home prices. Because we can’t have that conversation without looking at debt levels. And I think that’s where the turning point still is, whether in conversations or in real life. You think things are looking up? Okidoke, so what happened to the debt that caused the 2007/8 crisis? Well, personal debt went down a tad (foreclosures), though plastic is all the rage again, bank debt (by far the largest) has been hidden behind a too big to fail wall, and federal debt is on its way out of the ballpark, going going but by no means gone.
But hey, everything seems normal right? Well, unless you’re in Greece, or Italy, or Spain, or Detroit, or you’re in that fast growing American army that just lost your foodstamps and your unemployment benefits. So is it possible that maybe things seem normal for you because they no longer do for other people? If it looks like what it was before, that must be real, right?, that couldn’t be an temporary illusion bought with debt, like getting a new credit card and using it to pay the mortgage and the kids’ school fees and dentist bills till it’s maxed out after a few weeks or months? How many people do you think went routes just like that? And where are they now?
Does anyone think that the debt pays off itself? And even if you do, please note that it hasn’t so far: it’s only grown. How do you think that will end? How could it possibly end?”
 Let’s say there are three important kinds of debt: household, financial and federal (national) government. That is, if you allow me to skip over lower level government debt and non-financial business debt for now. Which shouldn’t be ignored, I know, we’ll see a surge in bankruptcies in municipalities and businesses, but let’s look at the three “big ones” today.
Household debt has gone down a little, despite resurgent plastic and soaring student loans. People have a lot less, homes have lost a lot of value, foreclosures have been executed, and what new jobs there are pay much less than those that existed before the crisis (not that I would argue the crisis ever ended, but many do).
Financial sector debt is a whole different story. Both financial institutions and governments (including Fed and other regulators) go through huge troubles to hide financial sector debt from view. It still just lies festering in the vaults, though for quite a few “assets” there’s been a change of vaults: from private banks to public coffers like the Fed. It’s been so ridiculous for so long that we’ve lost track and sight of it, but it’s still true: the most important factor in causing the 2007/8 crisis is still completely hidden from scrutiny. That fact alone should make you very weary: if there were no very large problems with all these smelly assets, they would have been hauled out into the open, and long ago.
A point I have belabored ad nauseum. Just so you know I’m not a lone fool on the hill in this, Zero Hedge had a piece recently on the topic, from Phoenix Capital Research: 
To This Day, No One Knows What Financial Firms Are Sitting on
As powerful as it may be, the Fed is not the market. And since the Fed failed to restore trust in the system by forcing all bad debts to light, the financial world has grown increasingly volatile and broken as investors grow increasingly distrustful of the system and begin to pull their money from it: see market volumes continuing to plunge.[..]
That lack of trust continues to this day. In the post-Lehman collapse, instead of forcing real derivative and credit risk out into the open, the Federal Reserve and regulators instead suspended accounting standards and allowed financial firms (and other corporate entities) to continue to lie about the true state of their balance sheets. As a result of this, the financial sector remains rife with fraud and impossible to accurately value (how can you value a business that is lying about its balance sheet?).
Those times in which a company was forced to value its assets at market prices have always seen said values losing 80%+ value in short order: consider Washington Mutual, which sported a book value north of $70 billion right up until it was sold for… $2 billion. This type of fraud is endemic in the system. Indeed, we got a taste of just how problematic a lack of transparency can be with MF Global’s bankruptcy, in which a firm with $42 billion in assets lost over 80% of its value since August only to reveal in bankruptcy that it had stolen over $700 million worth of clients’ money.
That MF Global engaged in fraud and stole clients’ money is noteworthy. However, the far more important issue is: HOW did this company receive primary dealer status from the NY Fed nine months before imploding? The Primary Dealers are the banks that actively engage in day to day activities with the New York Fed regarding the Fed’s monetary policies. Primary Dealers also participate in US Treasury auctions.
Put another way, Primary Dealers are the most elite, well-connected financial firms in the world. They have unequal access to both the Fed and the US Treasury Dept. In order for MF Global to have attained this status it must have passed through a review by: 1) The New York Fed and 2) The SEC. [..] This is not a quick nor superficial process. MF Global passed through all of these reviews to became a primary dealer in February 2011. A mere nine months later, the firm is in Chapter 11 and has admitted to stealing clients’ funds to maintain liquidity.
These developments reveal, beyond any doubt, that financial oversight in the US is virtually non-existent. This returns to my primary point: that trust has been lost in the system. And until it is restored, the system will remain broken.
A final note on this: the NY Fed is the single most powerful entity in charge of the Fed’s daily operations. How can any investor believe that the Fed can manage the system and restore trust when the NY Fed granted MF Global primary dealer status a mere nine months before the latter went bankrupt? If the NY Fed cannot accurately audit a financial firm’s risks during a six month review, then there is NO WAY an ordinary investor can do so.
This is one of the biggest risks in the system: that no one has a clue what financial entities are sitting on in terms of garbage derivatives and debts. As MF Global proved, this risk can result in a TOTAL loss of funds.
 So, financial sector debt? Nobody knows but the people with the legal and political power to hide it away, and slowly transfer it to the public. When you’ve seen numbers like $1 quadrillion for the derivatives trade, it’s hard not be very afraid about how it will all end, but we apparently prefer temporary rosy illusions to being afraid. After all, who talks about derivatives these days?
But, as bad as it may be, we don’t even need to scrutinize financial sector debt to get an idea of what we’re in for. Government debt will do that for us.
As we know, US federal debt is now over $17 trillion, and growing fast: 

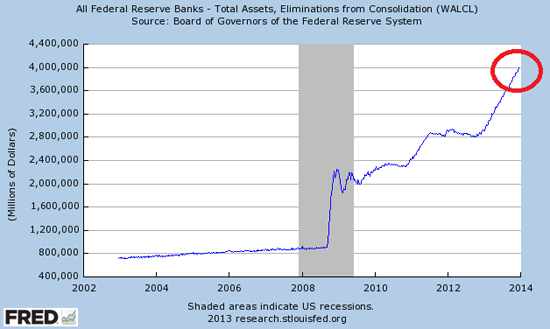
 While the Fed balance sheet has surged to $4 trillion:
 In that context, Mish wrote a piece over the weekend on the interest America pays on its debt:
When Will Interest on US National Debt Exceed $1 Trillion?
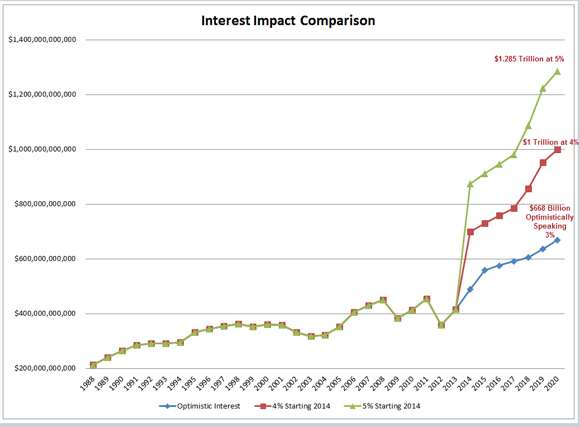
Really think the Fed is going to hike? They know they can’t, and the Fed is disingenuous as to why.
A year ago the Fed was discussing 6.5% as a trigger point. In December, the Wall Street Journal noted the “Fed’s Shifting Unemployment Guideposts”. Now, in the wake of a massive collapse in the labor force in which unemployment rate just dropped to 6.7% it’s easy to understand why the goalposts shifted.
The Fed pretends its interest rate policy is about a dual mandate of jobs and GDP growth. The above charts show the real reason for the shift: the Fed is in a box of its own making and it has no freaking idea how to get out of the box.
Mish also quotes Peter Tanous in his piece, who says 2012 total income tax revenues for the US government were $1.1 trillion. So the real question becomes: when will interest on the debt be more than income tax revenue? How far away can that moment be? The Fed may not hike, but the Fed is not the market. And what will happen when the moment comes that all tax revenue goes to interest payments? Raise the debt ceiling, no doubt. But that must surely stop when the interest on the debt overpowers income tax revenue.
This interest thing made me think back of a graph I published some time ago, from Zero Hedge. It’s also about interest. In this case, the interest lost to savers through the ZIRP policy. Chris Turner calculated there that American savers lost $10.8 trillion over 12 years, when compared to average interest rates over a 50-year period. 
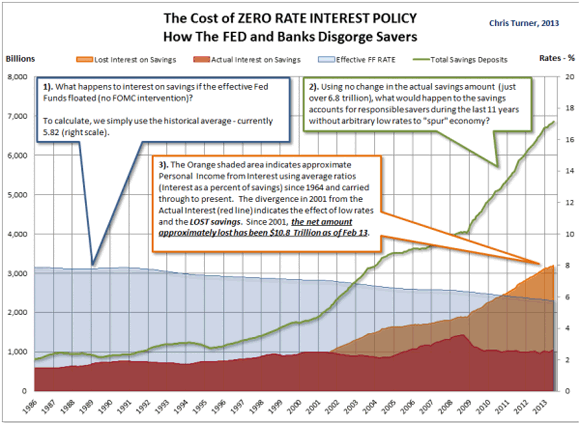
 That’s another trillion a year, on top of the threat of a fast rising interest rate on government debt. Better start working real hard, guys. $2 trillion is $6000 per capita per year that you need to cough up. Of course you can argue that rising interest rates would be good for savers, so those numbers are not entirely correct, but America’s a nation of debtors, not savers, and rising interest rates will hit for instance the housing sector like a sledgehammer. By the time this becomes reality, you’re going to wish you were losing savings only.
For a global picture, let’s return to an article I wrote in July 2013, with help from quotes sent by my friend VK:

Credit growth precedes GDP growth. In the 2002-2011 period world credit growth has been close to 12% per annum & GDP growth at 4% (11.7% vs 3.6% actually as per Hayman Capital Research ). Total global debt (public & private) is about $210 trillion today. And global GDP is $65 trillion. If you project the trends forward, total global debt will be $635 trillion in a decade! Global GDP will be $96 trillion, i.e. total global Debt-to-GDP of over 650% in 10 years.
Key point, for the next decade to equal the last one: to achieve global growth someone needs to borrow $425 trillion over the next decade. US total debt must rise to $166 trillion by 2023 & EU total debt must rise to $195 trillion. In the next 6 years more money must be lent out than in all the previous thousands of years of human history combined!! [..] Assuming US Treasury yields rise to 5% and thus assuming the global average interest rate is 7%, total debt repayment will be $26.5 trillion roughly annually.
 It gets surreal pretty fast, doesn’t it? But it’s really just projecting recent trends into the near future, no more, no less. 12% annual credit (aka debt) growth is how the story of stock market records and rising home prices is kept alive. In the US, in Japan, in Europe.
And if you think the US is bad, look at the story Tyler Durden had on China: 
… while the Fed creates $1 trillion in reserves each year, and dropping post taper, China is responsible for $3.6 trillion in loan creation annually – yank that and it’s game over for a world in which “growth” is not more than debt creation.
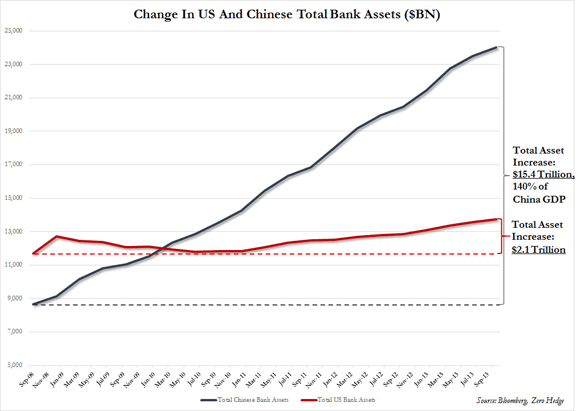
Applying a realistic, not made up bad debt percentage, somewhere in the 10% ballpark, and one gets a total bad debt number for China of… $2.5 trillion, and rising at a pace of $400 billion per year. No, really. Good luck.
I would think 10% is a very low bad debt percentage for China and its economy effectively controlled by a shadow banking system to a rapidly increasing extent. That’s like saying only 10% of US bank assets were bad in 2007. But the gist of this is obvious: China is a huge credit bomb, rivaling the US in that aspect too.

What’s more, there is a side to credit that is not often mentioned, but is absolutely essential. Credit can be a good thing, provided it is used for constructive purposes (and I don’t mean the construction of ghost cities). In the US, the days when that applied are long gone, and credit is a burden only (except for building illusions), because it’s heaped upon this incredible pile of already existing debt. China, though only for a fleeting moment, has it somewhat better in this regard.
The data leave little room for doubt. I think everyone can understand the principle behind this graph: 
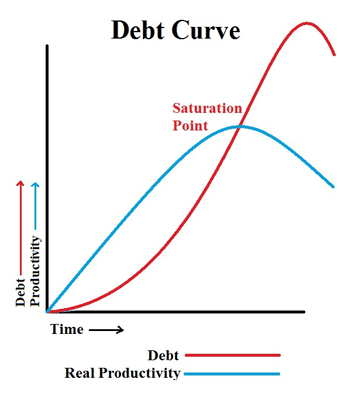

Debt aka credit can stimulate productivity, but not indefinitely, and absolutely not when it’s piled upon an existing mountain of debt. Credit overshoots productivity, and keeps rising while the latter is on its way down. Until it no longer can. It’s real simple. We all get it instinctively.
Where the US is in this process becomes clear in this pretty familiar graph:
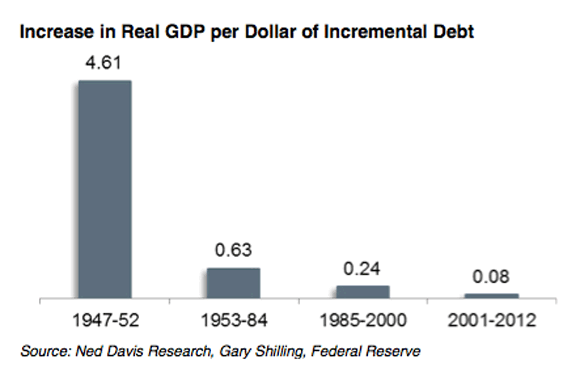

Which can also be expressed this way:

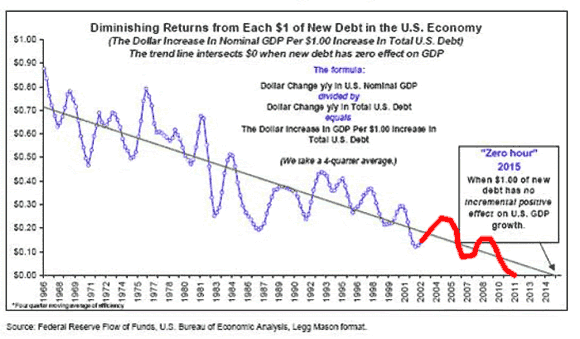

By 2015, an increase in debt in the US will no longer produce any growth at all. Then it’s all just pushing on a string. Or game over, or whatever you want to call it, pick a flavor of your taste. And then? What then? VK had a nice comment on that as well, especially when combined with Durden’s graph above:
Credit growth in China was 5.9x faster than GDP growth in Q1 2013. 17 cents GDP gain for every dollar borrowed! They’re approaching the US and Europe.
Dollar for dollar, or cent for cent rather, China is where the US was just 10 years ago … As I said, that last graph is pretty familiar, and while it’s not cast in stone, you can bet it serves as a flashing beacon for many people. But most are going to sail the boat anyway, thinking they’ll be smart enough to jump off before it hits the Victoria Falls. They can’t help themselves. The smarter ones have been saying their goodbyes for a while now.
There are a few major, and inevitable, events we’re approaching: US (and EU, and Japan) debt payments that become larger than total income tax revenues, and marginal productivity of debt sinking below zero for real. If you think the most important signals coming out of the economy are stock market records and rising home prices, I would urge you to think again. As for China, all we can do is wait. And perhaps pray, if that’s your thing. Take your pick of inflection points there, how could you go wrong?
But remember, always, when you read anything at all about the economy, ask yourself: “what about the debt”? If something, anything, that happens or is decided, certainly in the west, means more debt is piled on, beware.
This article addresses just one of the many issues discussed in Nicole Foss’ new video presentation, Facing the Future, co-presented with Laurence Boomert and available from the Automatic Earth Store. Get your copy now, be much better prepared for 2014, and support The Automatic Earth in the process!
By Raul Ilargi Meijer
Website: http://theautomaticearth.com (provides unique analysis of economics, finance, politics and social dynamics in the context of Complexity Theory)
Raul Ilargi Meijer Archive |
© 2005-2022 http://www.MarketOracle.co.uk - The Market Oracle is a FREE Daily Financial Markets Analysis & Forecasting online publication.


